MATLAB: An Introduction with Applications
6th Edition
ISBN: 9781119256830
Author: Amos Gilat
Publisher: John Wiley & Sons Inc
expand_more
expand_more
format_list_bulleted
Question
Hello!
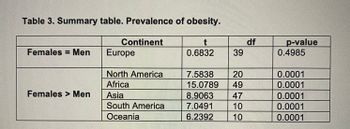
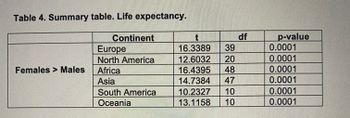
Please analyse the table 3 and 4 in the image attached.
the data is supposed to see if there is a relationship between the prevalence of obesity(table3) or life expectancy (table4) between males and females.
thank you!


Expert Solution
This question has been solved!
Explore an expertly crafted, step-by-step solution for a thorough understanding of key concepts.
Step by stepSolved in 3 steps

Knowledge Booster
Similar questions
- Write the equation for the relationship between advertisement and record sales and describe what happens to your outcome variable with every increase in your predictor variable.arrow_forwardplease help what did i do wrong?arrow_forwardHere is the data to solve these 3 question. Please give me all this 3 questions answer.arrow_forward
- Can this be converted into a frequency histogram?arrow_forwardCan you find a set of data such that the mean, median, and variance are all equal to each other? Find as many data sets as possible. If none are possible, explain why. If many are possible explain why. If you find any patterns explain what they are and how they are useful in the hunt for understanding this question.arrow_forwardWhat do you mean by relative frequency?arrow_forward
- find an example of when statistics were misused/skewed and state the reason why you think the statistics were reported that way.arrow_forwardif we had another data set made up of individuals' ages and nearly all the people were younger than 25 but a small percentage were over 50, and a few were in their 80s, how would you describe shape if the age distribution?arrow_forwardSurveys always provide data that is 100% accurate from feedback from participants True or Falsearrow_forward
- What is the equation of finding an estimate on a negative scatter plot?arrow_forwardCorrelation does not imply causation. What does this mean? Find an example in the media that needs to understand this concept and explain it to your peers. Be sure to include the link to the example you are using.arrow_forwardSummarize the effect different kinds of outliers can have on a data set in terms of how we interpret whether we have a good model or not.arrow_forward
arrow_back_ios
SEE MORE QUESTIONS
arrow_forward_ios
Recommended textbooks for you
 MATLAB: An Introduction with ApplicationsStatisticsISBN:9781119256830Author:Amos GilatPublisher:John Wiley & Sons Inc
 Probability and Statistics for Engineering and th...StatisticsISBN:9781305251809Author:Jay L. DevorePublisher:Cengage Learning
 Statistics for The Behavioral Sciences (MindTap C...StatisticsISBN:9781305504912Author:Frederick J Gravetter, Larry B. WallnauPublisher:Cengage Learning
 Elementary Statistics: Picturing the World (7th E...StatisticsISBN:9780134683416Author:Ron Larson, Betsy FarberPublisher:PEARSON
 The Basic Practice of StatisticsStatisticsISBN:9781319042578Author:David S. Moore, William I. Notz, Michael A. FlignerPublisher:W. H. Freeman
 Introduction to the Practice of StatisticsStatisticsISBN:9781319013387Author:David S. Moore, George P. McCabe, Bruce A. CraigPublisher:W. H. Freeman

MATLAB: An Introduction with Applications
Statistics
ISBN:9781119256830
Author:Amos Gilat
Publisher:John Wiley & Sons Inc

Probability and Statistics for Engineering and th...
Statistics
ISBN:9781305251809
Author:Jay L. Devore
Publisher:Cengage Learning

Statistics for The Behavioral Sciences (MindTap C...
Statistics
ISBN:9781305504912
Author:Frederick J Gravetter, Larry B. Wallnau
Publisher:Cengage Learning

Elementary Statistics: Picturing the World (7th E...
Statistics
ISBN:9780134683416
Author:Ron Larson, Betsy Farber
Publisher:PEARSON

The Basic Practice of Statistics
Statistics
ISBN:9781319042578
Author:David S. Moore, William I. Notz, Michael A. Fligner
Publisher:W. H. Freeman

Introduction to the Practice of Statistics
Statistics
ISBN:9781319013387
Author:David S. Moore, George P. McCabe, Bruce A. Craig
Publisher:W. H. Freeman