
Practical Management Science
6th Edition
ISBN: 9781337406659
Author: WINSTON, Wayne L.
Publisher: Cengage,
expand_more
expand_more
format_list_bulleted
Related questions
Question
Develop a POQ solution and calculate total relevant costs for the data in the preceding table.
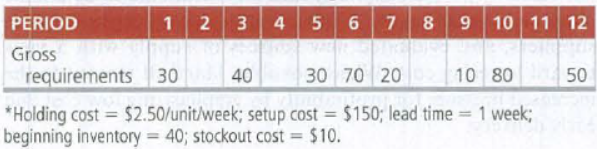

Transcribed Image Text:PERIOD
Gross
1 2 3 4 5 6 7 8 9 10 11 12
JEHERE
30
requirements
30 70 20
10 80
TAT
*Holding cost $2.50/unit/week; setup cost = $150; lead time = 1 week;
beginning inventory = 40; stockout cost = $10.
40
50
Expert Solution
This question has been solved!
Explore an expertly crafted, step-by-step solution for a thorough understanding of key concepts.

This is a popular solution

Trending nowThis is a popular solution!

Step by stepSolved in 4 steps with 8 images

Knowledge Booster

Similar questions
- Consider the following financial data from the past year for Midwest Outdoor Equipment Corporation. Annual sales $24,324,000 Net income 2,975,000 Cost of goods sold 12,600,000 Total assets 10,550,000 Inventory 2,875,000 Receivables 3,445,000 The Midwest Outdoor Equipment Corporation has entered into a new contract with a major supplier of raw materials used in the manufacturing process. Under the new arrangement, called vendor managed inventory, the supplier manages its raw material inventory inside the manufacturer’s plant and bills only the manufacturer when the manufacturer consumes the raw material. This is expected to reduce total assets by $2 million. What is the expected change in return on assets? Note: Round your answer to 2 decimal places.arrow_forwardThe department at a local department store has tracked the sales of a product over the last ten weeks. Forecast demand using exponential smoothing with an alpha of 0.3, and an initial forecast of 30.0 for period 1. a. Calculate the MAD covering periods 2-10. b. Calculate the tracking signal covering periods 2-10. c. What do you recommend? Period (t) Demand (At) 1 24 2 23 3 26 4 36 5 26 6 30 7 32 8 26 9 25 10 28arrow_forwardforgiven product demand the time series trying equation is 53.3+2.1 X what is your forecast demand for period six?arrow_forward
- Manager Chris Channing of Fabric Mills, Inc., has developed the forecast shown in the table for bolts of cloth. The figures are in hundreds of bolts. The department has a regular output capacity of 275(00) bolts per month, except for the seventh month, when capacity will be 240(00) bolts. Regular output has a cost of $43 per hundred bolts. Workers can be assigned to other jobs if production is less than regular. The beginning inventory is zero bolts. Month 1 2 3 4 5 6 7 Total Forecast 275 350 225 300 280 275 270 1,975 a. Develop a chase plan that matches the forecast and compute the total cost of your plan. Overtime is $68 per hundred bolts. Regular production can be less than regular capacity b. Would the total cost be less with full regular production each period with no overtime, but using a subcontractor to handle the excess above regular capacity at a cost of $53 per hundred bolts? Backlogs are not allowed. The inventory carrying cost is $2 per hundred bolts. (Round…arrow_forwardPrepare a Demand Forecast for “Year 5” using Excel. Quarterly Data for Cars Sales Yt Year Quarter Sales (1000s) Year 1 1 4.80 2 4.10 3 6.00 4 6.50 Year 2 1 5.80 2 5.20 3 6.80 4 7.40 Year 3 1 6.00 2 5.60 3 7.50 4 7.80 Year 4 1 6.30 2 5.90 3 8.00 4 8.40 Year 5 1 2 3 4arrow_forwardUnderstand how forecasting is essential to supply chain planning.arrow_forward
- part b)arrow_forwardWhat exactly are CMSs? What are the advantages and disadvantages of this?arrow_forwardThe operations manager has compiled data on demand for the two most popular books from order records for the previous 14 months, as shown in the table below. Study the forecast figures for ‘JHS Science Textbook’ from the table and determine if a demand pattern is obvious, and hence prepare a monthly forecast for the next four months for this product. Briefly explain why you chose the particular method used for this forecast. Month JHS Science Textbook (cartons) SHS Math Textbook (cartons) 1 50 40 2 54 38 3 57 41 4 60 46 5 64 42 6 67 41 7 90* 41 8 76 47 9 79 42 10 82 43 11 85 42 12 87 49 13 92 43 14 96 44 *Unusual order due to flooding of a major distributor’s warehouse.arrow_forward
arrow_back_ios
arrow_forward_ios
Recommended textbooks for you
- Practical Management ScienceOperations ManagementISBN:9781337406659Author:WINSTON, Wayne L.Publisher:Cengage,
 Operations ManagementOperations ManagementISBN:9781259667473Author:William J StevensonPublisher:McGraw-Hill Education
 Operations and Supply Chain Management (Mcgraw-hi...Operations ManagementISBN:9781259666100Author:F. Robert Jacobs, Richard B ChasePublisher:McGraw-Hill Education
 Purchasing and Supply Chain ManagementOperations ManagementISBN:9781285869681Author:Robert M. Monczka, Robert B. Handfield, Larry C. Giunipero, James L. PattersonPublisher:Cengage Learning
 Production and Operations Analysis, Seventh Editi...Operations ManagementISBN:9781478623069Author:Steven Nahmias, Tava Lennon OlsenPublisher:Waveland Press, Inc.
Practical Management Science
Operations Management
ISBN:9781337406659
Author:WINSTON, Wayne L.
Publisher:Cengage,
Operations Management
Operations Management
ISBN:9781259667473
Author:William J Stevenson
Publisher:McGraw-Hill Education
Operations and Supply Chain Management (Mcgraw-hi...
Operations Management
ISBN:9781259666100
Author:F. Robert Jacobs, Richard B Chase
Publisher:McGraw-Hill Education
Purchasing and Supply Chain Management
Operations Management
ISBN:9781285869681
Author:Robert M. Monczka, Robert B. Handfield, Larry C. Giunipero, James L. Patterson
Publisher:Cengage Learning
Production and Operations Analysis, Seventh Editi...
Operations Management
ISBN:9781478623069
Author:Steven Nahmias, Tava Lennon Olsen
Publisher:Waveland Press, Inc.