
Essentials of Business Analytics (MindTap Course List)
2nd Edition
ISBN: 9781305627734
Author: Jeffrey D. Camm, James J. Cochran, Michael J. Fry, Jeffrey W. Ohlmann, David R. Anderson
Publisher: Cengage Learning
expand_more
expand_more
format_list_bulleted
Related questions
Question
thumb_up100%
What is the level of fixed costs of this accounting question?
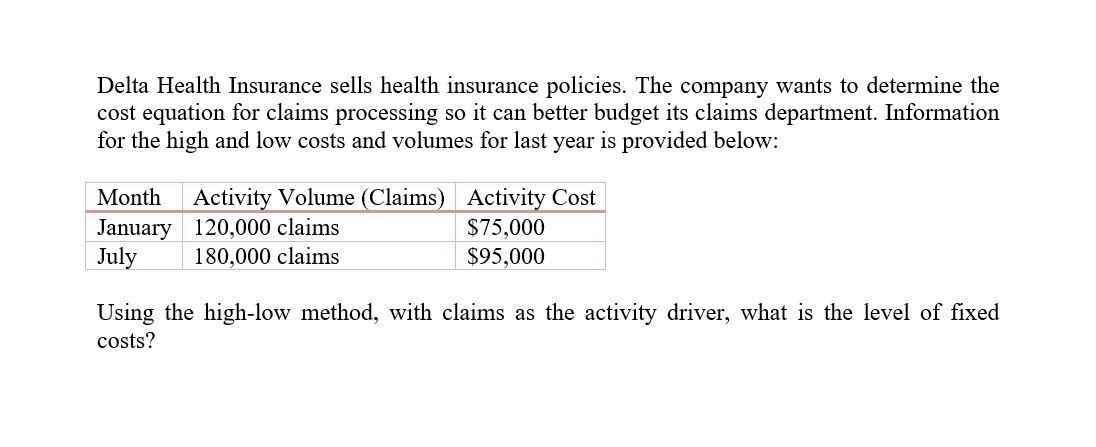

Transcribed Image Text:Delta Health Insurance sells health insurance policies. The company wants to determine the
cost equation for claims processing so it can better budget its claims department. Information
for the high and low costs and volumes for last year is provided below:
Month Activity Volume (Claims)
January 120,000 claims
Activity Cost
$75,000
July
180,000 claims
$95,000
Using the high-low method, with claims as the activity driver, what is the level of fixed
costs?
Expert Solution
This question has been solved!
Explore an expertly crafted, step-by-step solution for a thorough understanding of key concepts.

Step by stepSolved in 2 steps

Knowledge Booster

Similar questions
- Johnson Filtration. Inc., provides maintenance service for water filtration systems throughout southern Florida. Customers contact Johnson with requests for maintenance service on their water filtration systems. To estimate the service time and the service cost. Johnson’s managers want to predict the repair time necessary for each maintenance request. Hence, repair time in hours is the dependent variable. Repair time is believed to be related to three factors: the number of months since the last maintenance service, the type of repair problem (mechanical or electrical), and the repairperson who performs the repair (Donna Newton or Bob Jones). Data for a sample of 10 service calls are reported in the following table: Develop the simple linear regression equation to predict repair time given the number of months since the last maintenance service, and use the results to test the hypothesis that no relationship exists between repair time and the number of months since the last maintenance service at the 0.05 level of significance. What is the interpretation of this relationship? What does the coefficient of determination tell you about this model? Using the simple linear regression model developed in part (a), calculate the predicted repair time and residual for each of the 10 repairs in the data. Sort the data in ascending order by value of the residual. Do you see any pattern in the residuals for the two types of repair? Do you see any pattern in the residuals for the two repairpersons? Do these results suggest any potential modifications to your simple linear regression model? Now create a scatter chart with months since last service on the x-axis and repair time in hours on the y-axis for which the points representing electrical and mechanical repairs are shown in different shapes and/or colors. Create a similar scatter chart of months since last service and repair time in hours for which the points representing repairs by Bob Jones and Donna Newton are shown in different shapes and/or colors. Do these charts and the results of your residual analysis suggest the same potential modifications to your simple linear regression model? Create a new dummy variable that is equal to zero if the type of repair is mechanical and one if the type of repair is electrical. Develop the multiple regression equation to predict repair time, given the number of months since the last maintenance service and the type of repair. What are the interpretations of the estimated regression parameters? What does the coefficient of determination tell you about this model? Create a new dummy variable that is equal to zero if the repairperson is Bob Jones and one if the repairperson is Donna Newton. Develop the multiple regression equation to predict repair time, given the number of months since the last maintenance service and the repairperson. What are the interpretations of the estimated regression parameters? What does the coefficient of determination tell you about this model? Develop the multiple regression equation to predict repair time, given the number of months since the last maintenance service, the type of repair, and the repairperson. What are the interpretations of the estimated regression parameters? What does the coefficient of determination tell you about this model? Which of these models would you use? Why?arrow_forwardThe cost data for BC Billing Solutions for the year 2020 is as follows: Using the high-low method, express the companys overtime wages as an equation where x represents number of invoices processed. Assume BC has monthly fixed costs of $3,800. Predict the overtime wages if 9,000 invoices are processed. Predict the overtime wages if 6,500 invoices are processed. Using Excel, create a scatter graph of the cost data and explain the relationship between the number of invoices processed and overtime wage expense.arrow_forwardLising Therapy has a physical therapist who performs electro-mechanical treatments for its patients. During April, Lising had the following cost and output information: Required: 1. Calculate the cost per treatment for April. 2. Calculate the cost of services sold for April. 3. What if Lising found a way to reduce overhead costs by 20 percent? How would this affect the profit per treatment?arrow_forward
- Weber Valley Regional Hospital has collected data on all of its activities for the past 16 months. Data for cardiac nursing care follow: Required: 1. Using the high-low method, calculate the variable rate per hour and the fixed cost for the nursing care activity. 2. Run a regression on the data, using hours of nursing care as the independent variable. Predict cost for the cardiac nursing care for September Year 2 if 1,400 hours of nursing care are forecast. Evaluate the regression equation. How comfortable are you with the predicted cost for September Year 2? 3. Upon looking into the events that happened at the end of Year 1, you find that the cardiology ward bought a cardiac-monitoring machine for the nursing station. Administrators also decided to add a new supervisory position for the evening shift. Monthly depreciation on the monitor and the salary of the new supervisor together total 10,000. Now, run two regression equations, one for the observations from Year 1 and the second using only the observations for the eight months in Year 2. Discuss your findings. What is your predicted cost of the cardiac nursing care activity for September Year 2?arrow_forwardJensen Tire Auto is deciding whether to purchase a maintenance contract for its new computer wheel alignment and balancing machine. Managers feel that maintenance expense should be related to usage, and they collected the following information on weekly usage (hours) and annual maintenance expense (in hundreds of dollars). a. Develop a scatter chart with weekly usage hours as the independent variable. What does the scatter chart indicate about the relationship between weekly usage and annual maintenance expense? b. Use the data to develop an estimated regression equation that could be used to predict the annual maintenance expense for a given number of hours of weekly usage. What is the estimated regression model? c. Test whether each of the regression parameters 0 and 1 is equal to zero at a 0.05 level of significance. What are the correct interpretations of the estimated regression parameters? Are these interpretations reasonable? d. How much of the variation in the sample values of annual maintenance expense does the model you estimated in part (b) explain? e. If the maintenance contract costs 3,000 per year, would you recommend purchasing it? Why or why not?arrow_forwardNeed help with this accounting questionsarrow_forward
- Which of the preceding costs is variable? Fixed? Mixed? Explain.arrow_forwarda. Using the least squares method, develop the equation for predicting weekly receiving report costs based on the number of shipments received. b. What is the predicted amount of receiving report costs for a month (assume a month is exactly four weeks) in which 165 shipments are received?arrow_forwardThe managing director of a consulting group has the accompanying monthly data on total overhead costs and professional labor hours to bill to clients. Complete parts a through c. Click the icon to view the monthly data. a. Develop a simple linear regression model between billable hours and overhead costs. Overhead Costs = +xBillable Hours X Monthly Overhead Costs and Billable Hours Data (Round the constant to one decimal place as needed. Round the coefficient to four decimal places as needed. Do not include the $ symbol in your answers.) Overhead Costs Billable Hours 0 $315,000 3,000 $365,000 4,000 $395,000 5,000 $447,000 6,000 $530,000 7,000 $550,000 8,000arrow_forward
- Use the assumptions below to create calculations to determine annual and monthly revenue projections for each of the categories. Be sure to make the revenue category on the pro-forma view (above) descriptive and use your assumptions as drivers for the values calculated. Make it easy to change the assumptions to determine the impact of a change (up or down) in volume, rates and discounts. Insert lines or columns as needed. Camps and Schools require physicals before kids arrive. There are 150 camper physicals spread evenly in May and June. There are 500 school physicals, 25% in July, 65% in August, and 10% in September. The insurance companies in covering families in your community are split 50% BC/BS and 40% United Healthcare and no insurance (private pay). Your normal camper physical charge is $115. You give BC/BS an 18% discount and United Health care a 15% discount. The special promotion for campers without insurance (private pay) is $75. Camper Physical $ 115 Payor -…arrow_forwardConsider a telecommunication service provider. You have the following quarterly data: STATISTICS TYPICAL CONSUMER Number of referrals per period (n=n1+ n2) 5 of which, customers that joined due to the referral (n1) 3 of which, customers that would have joined anyway (n2) 2 Marketing cost per period (Mty) $30 Average gross margin (Aty) $78 Cost of referral (aty) $15 Acquisition cost savings (ACQ1ty and ACQ2ty) $10 Yearly discount rate (r) 15% Calculate CRV of a typical customer for one year (over 4 quarters).arrow_forwardMethod of Least Squares Refer to the information for Luisa Crimini on the previous page. Required: 1. Using a computer spreadsheet program such as Excel, run a regression on these data. Based on the regression output, write the cost formula for tanning. (Note: Round the fixed cost to the nearest dollar and the variable rate to the nearest cent.) 2. Using the formula computed in Requirement 1, what is the predicted cost of tanning services for September for 2,500 appointments? Use the following information for Exercises 3-44 through 3-46: Luisa Crimini has been operating a beauty shop in a college town for the past 10 years. Recently, Luisa rented space next to her shop and opened a tanning salon. She anticipated that the costs for the tanning service would primarily be fixed, but found that tanning salon costs increased with the number of appointments. Costs for this service over the past 8 months are as follows:arrow_forward
arrow_back_ios
SEE MORE QUESTIONS
arrow_forward_ios
Recommended textbooks for you
- Essentials of Business Analytics (MindTap Course ...StatisticsISBN:9781305627734Author:Jeffrey D. Camm, James J. Cochran, Michael J. Fry, Jeffrey W. Ohlmann, David R. AndersonPublisher:Cengage Learning
 Principles of Accounting Volume 2AccountingISBN:9781947172609Author:OpenStaxPublisher:OpenStax College
 Cornerstones of Cost Management (Cornerstones Ser...AccountingISBN:9781305970663Author:Don R. Hansen, Maryanne M. MowenPublisher:Cengage Learning
  Managerial Accounting: The Cornerstone of Busines...AccountingISBN:9781337115773Author:Maryanne M. Mowen, Don R. Hansen, Dan L. HeitgerPublisher:Cengage Learning
 Principles of Cost AccountingAccountingISBN:9781305087408Author:Edward J. Vanderbeck, Maria R. MitchellPublisher:Cengage Learning
Essentials of Business Analytics (MindTap Course ...
Statistics
ISBN:9781305627734
Author:Jeffrey D. Camm, James J. Cochran, Michael J. Fry, Jeffrey W. Ohlmann, David R. Anderson
Publisher:Cengage Learning
Principles of Accounting Volume 2
Accounting
ISBN:9781947172609
Author:OpenStax
Publisher:OpenStax College
Cornerstones of Cost Management (Cornerstones Ser...
Accounting
ISBN:9781305970663
Author:Don R. Hansen, Maryanne M. Mowen
Publisher:Cengage Learning
Managerial Accounting: The Cornerstone of Busines...
Accounting
ISBN:9781337115773
Author:Maryanne M. Mowen, Don R. Hansen, Dan L. Heitger
Publisher:Cengage Learning
Principles of Cost Accounting
Accounting
ISBN:9781305087408
Author:Edward J. Vanderbeck, Maria R. Mitchell
Publisher:Cengage Learning