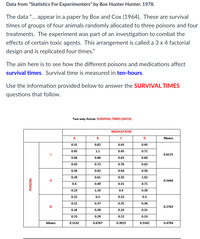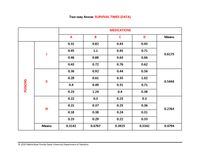
Data from “Statistics For Experimenters” by Box Hunter Hunter, 1978.
The data “… appear in a paper by Box and Cox (1964). These are survival times of groups of four animals randomly allocated to three poisons and four treatments. The experiment was part of an investigation to combat the effects of certain toxic agents. This arrangement is called a 3 x 4 factorial design and is replicated four times.”
The aim here is to see how the different poisons and medications affect survival times. Survival time is measured in ten-hours.
Use the information provided below to answer the SURVIVAL TIMES questions that follow.
SURVIVAL TIMES
Choose the correct answers for the items listed below.
Response = ["", "", ""]
Row factor, number of levels = ["", "", "", "", "", ""]
Column factor, number of levels = ["", "", "", "", "", ""]
Number of treatments = number of samples = ["", "", "", "", ""]
Number of subjects per sample = ["", "", "", "", ""]
Total number of observations = ["", "", "", "", ""]
Variance of the survival times for all animals given Medication D = ["", "", "", "", "", "", ""]
Total survival time for all animals given Poison III = ["", "", "", "", "", "", ""]
Average survival time for animals given Poison II and Medication C = ["", "", "", ""]


Trending nowThis is a popular solution!
Step by stepSolved in 2 steps

- You have been assigned to test the hypothesis that the average number of cars waiting in line for the drive-thru window during lunch hour differs between Chick-fil-A, Wendy's, and McDonald's. The following data show the number of cars in line during randomly selected times during the lunch hour at all three chains. Chick-fil-A(1) Wendy's(2) McDonald's(3) 7 7 6 10 8 7 11 5 6 8 3 7 9 2 9 Perform a one-way ANOVA using α = 0.05 to determine if a difference exists in the average number of cars waiting in line at the drive-thru during the lunch hour between these chains.arrow_forward. In a study to investigate the effect of regular physical exercise on the reduction of high blood pressure in males aged 60-65, the researchers selected at random a sample of n₁ =12 males suffering from high blood pressure in the given a 12ge group and for a two-year period placed the subjects on a daily physical exercise program. A second sample of n₂ =12 males suffering from high blood pressure in the given age group was selected and again for the two-year period this group of subjects were placed on a physical exercise program for which they were required to perform only once a week. Finally a third sample of n3 =12 males suffering from high blood pressure in the given age group was selected. No exercise program was required for individuals in sample three. At the end of the two-year period the reduction in blood pressure was measured for each of the subjects in the study and is presented in the table on the next page. Table V.1: Reduction in Blood pressure for three groups of…arrow_forwardA study is conducted in a large high school to determine if the proportion of students who plan to come to the upcoming football game differs across the grades. A random sample of 50 ninth graders, 50 tenth graders, 50 eleventh graders, and 50 twelfth graders was selected. The responses are displayed in the table. The principal would like to know if these data provide convincing evidence that the distribution of responses differs across the grades in the population of all students in her school. The random and 10% conditions are met, and this table of expected counts shows that all expected counts are at least 5. What is the value of the chi-square test statistic for this test? χ‑2 = 0.49 χ‑2 = 0.70 χ‑2 = 0.84 χ‑2 = 200arrow_forward
- (c) Suppose that after looking at the data the researcher decided to test the research questions listed below. Conduct the appropriate tests to answer these questions. Report and fully interpret the results of each test conducted. On average: (iv) Do Asian students score significantly higher/lower than White students in Reading? race: 1 - hispanic, 2 - asian, 3 - black, 4 - white race RDG 1 34 1 47 1 42 1 39 1 36 1 50 1 63 1 44 1 47 1 44 1 50 1 44 1 47 1 42 1 42 1 47 1 60 1 39 1 57 1 73 1 47 1 39 1 35 1 39 1 48 1 31 1 52 1 47 1 36 1 47 1 34 1 52 1 42 1 37 1 44 1 71 1 47 1 42 1 42 1 47 1 52 1 52 1 39 1 31 1 60 1 47 1 39 1 42 1 47 1 42 1 36 1 50 1 34 1 55 1 28 1 42 1 44 1 60 1 39 1 36 1 44 1 39 1 39 1 42 1 42 2 52 2 65 2 42 2 47 2 52 2 44 2 52 2 47 2 65 2 63 2 60 2 47 2 65 2 53 2 68 2 55 2 39 2 52 2 65 2 52 2 57…arrow_forwardThese two questions please.arrow_forwardA CBS News poll involved a nationwide random sample of 651 adults, asked those adults about their party affiliation (Democrat, Republican or none) and their opinion of how the US economy was changing ("getting better," "getting worse" or "about the same"). The results are shown in the table below. better same worse Republican 38 104 44 Democrat 12 87 137 none 21 90 118 If we randomly select one of the adults who participated in this study, compute: (round to four decimal places)a.P(Republican) = b.P(same) = c.P(same|Republican) = d.P(Republican|same) = e.P(Republican and same) =arrow_forward
- ▾ Part 1 of 4 A pharmaceutical company claims their new diabetes medication results in less variance in a patient's glucose level than if the patient were on no medication at all. An endocrinologist wishes to test this claim. She divides participants randomly into two groups. Group A consists of 20 diabetics who received the medication; group B consists of 26 diabetics who received a placebo. After two weeks, the blood sugar level of each patient in each group was measured with the following results (in mg/dL): Group A: 77.8, 229.4, 199.9, 110.1, 180.2, 116.1, 139.7, 171.1, 37.4, 158.1, 88.4, 195.5, 246.1, 142.4, 178.1, 105.5, 179.6, 146.1, 78.8, 123.7 Group B: 124.5, 130.1, 136, 162.8, 113.4, 72.8, 142.6, 50.3, 179.8, 197, 230, 194.3, 171, 109.3, 114.4, 107.5, 114.7, 195.3, 127.7, 126.4, 85.6, 166.7, 182.3, 113.5, 216.7, 162.8 Perform a hypothesis test using a 6% level of significance to test the pharmaceutical company's claim. Step 1: State the null and alternative hypotheses. Ho:…arrow_forward1. A developmental psychologist would also like to determine how much fine motor skill improves for children from age 3 to age 4 but is worried about practice effects. She takes a random sample of 9 three-year old children and a second sample of 9 four-year olds and measures fine motor skill in each using the same test described above. Her data are provided below. Three Year Olds: 40, 35, 38, 39, 40, 50, 40, 38, 42 Four Year Olds: 35, 36, 39, 29, 35, 34, 33, 34, 35 a. Is there a significant difference in the motor skills from age three to four? Test with an α = 0.01. b. What type of error is possible based on the outcome? c. Calculate and interpret the effect size. d. What is the mean motor skill score for the age three children? What is the mean motor skill score for the age four children?arrow_forward
 MATLAB: An Introduction with ApplicationsStatisticsISBN:9781119256830Author:Amos GilatPublisher:John Wiley & Sons Inc
 Probability and Statistics for Engineering and th...StatisticsISBN:9781305251809Author:Jay L. DevorePublisher:Cengage Learning
 Statistics for The Behavioral Sciences (MindTap C...StatisticsISBN:9781305504912Author:Frederick J Gravetter, Larry B. WallnauPublisher:Cengage Learning
 Elementary Statistics: Picturing the World (7th E...StatisticsISBN:9780134683416Author:Ron Larson, Betsy FarberPublisher:PEARSON
 The Basic Practice of StatisticsStatisticsISBN:9781319042578Author:David S. Moore, William I. Notz, Michael A. FlignerPublisher:W. H. Freeman
 Introduction to the Practice of StatisticsStatisticsISBN:9781319013387Author:David S. Moore, George P. McCabe, Bruce A. CraigPublisher:W. H. Freeman


