
MATLAB: An Introduction with Applications
6th Edition
ISBN: 9781119256830
Author: Amos Gilat
Publisher: John Wiley & Sons Inc
expand_more
expand_more
format_list_bulleted
Related questions
Question
thumb_up100%
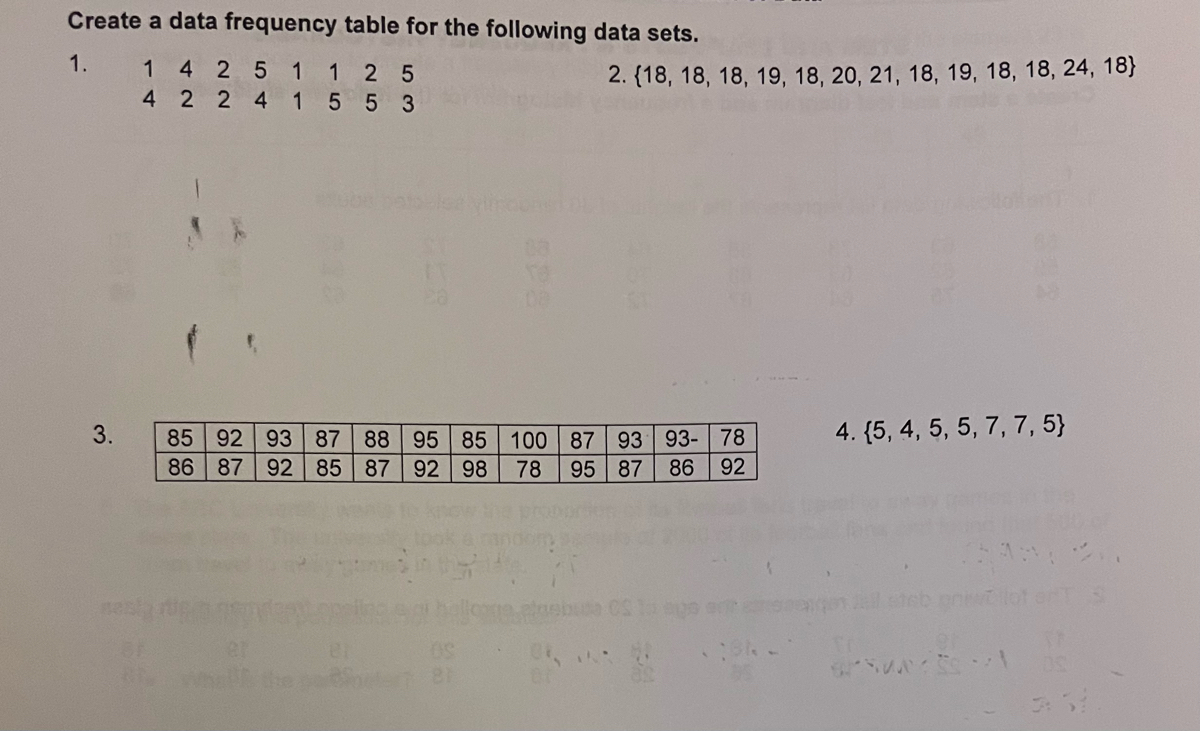

Transcribed Image Text:Create a data frequency table for the following data sets.
1.
1 4 25 1
125
2. (18, 18, 18, 19, 18, 20, 21, 18, 19, 18, 18, 24, 18}
4 2 2 4 1 553
3.
85 92 93 87 88 95 85
86 87 92 85 87 92 98 78
100
87
93 93- 78
4. {5, 4, 5, 5, 7, 7, 5}
95
87 86 92
81
teb
Expert Solution
This question has been solved!
Explore an expertly crafted, step-by-step solution for a thorough understanding of key concepts.

Step by stepSolved in 2 steps

Knowledge Booster

Similar questions
- Below are the times (in days) it takes for a sample of 16 customers from Jack's computer store to pay their invoices. 19, 15, 43, 39, 35, 31, 27, 22, 34, 34, 34, 30, 30, 26, 26, 26 Send data to calculator Draw the frequency polygon for these data using an initial class boundary of 14.5 and a class width of 7. Note that you can add or remove classes from the figure. Label each class with its midpoint. Frequency 6- Time (in days) Check Save For Later Submit Ass O 2021 McGraw Hill LLC. All Rights Reserved Terms of Use Privacy Center MacBook ►► 4) SC FS F7 FB F9 F11 F2 F4 + % & 2$ 4. @ 23 2 3 7 8 9 Q W E R T Y U A S F G H. K > V В alt alt MOSISO command option ntrol option command .. .· V CUarrow_forward3. Construct a Grouped Frequency Distribution on the data below 19 61 21 33 26 36 31 58 28 19 20 22 31 63 27 76 68 26 42 46 38 48 66 43 26 18 51 22 52 53 32 35 32 40 30 22 18 27 23 32 37 27 38 42 45 55 42 45 50 47arrow_forwardDetermine the leaves for the given data points in the range of 80 to 89 for this stem leaf plotarrow_forward
- Consider the data set below 65, 86, 69, 71, 51, 82, 57, 86, 59, 59, 62, 73, 74, 108, 78, 78, 79, 84, 88, 91, 106, 107, 98, 102 Use the following classes to form a frequency table for this data. Include relative frequency, cumulative frequency, and cumulative relative frequency. 48 to 55 56 to 63 64 to 71 72 to 79 80 to 87 88 to 95 96 to 103 104 to 111arrow_forwardCreate a stem and leaf diagram and a frequency histogram for the following situations. 1. The following data list represents the heights of 30 randomly selected adults. 63 73 58 56 64 68 72 63 67 59 62 68 70 67 71 64 62 64 75 64 67 60 63 62 71 68 7780 72 225 63 3365 9859 77222 88589arrow_forwardThe following data represents the age of 30 lottery winners. 23 29 33 34 34 37 38 39 41 43 48 50 50 51 52 52 53 54 54 57 57 60 60 61 64 65 66 66 77 82 Complete the frequency distribution for the data. Bin Frequency 20-29 30-39 40-49 50-59 60-69 70-79 80-89arrow_forward
- 1.hoose the correct class width for the frequency distribution. Number in attendanceat school clubs Frequency 10–44 12 45–79 5 80–114 9 115–149 4 150–185 2 a.30 b.34 c.32 d.35arrow_forward3. Complete the two-way frequency table below about the type of party your little sister's friends enjoy the most. Gender Male Female Total 2 Party Туре Bowling Skating Dancing 3 11 Total Part A: Determine P(Male). Part B: Determine P(Skating). Part C: Determine P(Male and Skating). Part D: Determine P(Male or Skating).arrow_forward1. Find the class midpoints of the first three classes (20-29,30-39, and 40-49) 2. Is the data displayed in the frequency table approximately normal? Explain your reasoningarrow_forward
- 1. 1, 2, 2, 3, 3, 4, 5, 6, 7, 7, 8, 8, 8, 9, 10, 11, 11, 13, 15, 15, 21,24, 28, 32 a. Construct a frequency table. b. Construct a histogram (use 5 as the number of classes and starting point at 1).arrow_forwardA geographer studying West Africa would like to know the size of stones in the delta region where the Niger River runs into the Gulf of Guinea. He collects 53 stones and measures the diameter of each, and so obtains the following measurements, in centimeters as seen below in the frequency table. Size (cm) Frequency [0, 2) [2, 4) 17 13 [4, 6) [6, 8) [8, 10) [10, 12) 10 7 4 a. Create a histogram for the measured stones. Include all labels. b. How many stones are larger than or equal to 6 cm?arrow_forwardBelow are the times (in days) it takes for a sample of 22 customers from Jack's computer store to pay their invoices. 19, 15, 43, 39, 35, 31, 27, 22, 18, 14, 42, 38, 13, 13, 41, 41, 37, 37, 37, 33, 33, 33 Send data to calculator Draw the frequency polygon for these data using an initial class boundary of 12.5 and a class width of 7. Note that you can add or remove classes from the figure. Label each class with its midpoint. Frequency 7. Check 26°F Clear Q Search 0:00 00:0 X Save For Later C Submit Assignmearrow_forward
arrow_back_ios
SEE MORE QUESTIONS
arrow_forward_ios
Recommended textbooks for you
- MATLAB: An Introduction with ApplicationsStatisticsISBN:9781119256830Author:Amos GilatPublisher:John Wiley & Sons Inc
 Probability and Statistics for Engineering and th...StatisticsISBN:9781305251809Author:Jay L. DevorePublisher:Cengage Learning
 Statistics for The Behavioral Sciences (MindTap C...StatisticsISBN:9781305504912Author:Frederick J Gravetter, Larry B. WallnauPublisher:Cengage Learning
  Elementary Statistics: Picturing the World (7th E...StatisticsISBN:9780134683416Author:Ron Larson, Betsy FarberPublisher:PEARSON
 The Basic Practice of StatisticsStatisticsISBN:9781319042578Author:David S. Moore, William I. Notz, Michael A. FlignerPublisher:W. H. Freeman
 Introduction to the Practice of StatisticsStatisticsISBN:9781319013387Author:David S. Moore, George P. McCabe, Bruce A. CraigPublisher:W. H. Freeman
MATLAB: An Introduction with Applications
Statistics
ISBN:9781119256830
Author:Amos Gilat
Publisher:John Wiley & Sons Inc
Probability and Statistics for Engineering and th...
Statistics
ISBN:9781305251809
Author:Jay L. Devore
Publisher:Cengage Learning
Statistics for The Behavioral Sciences (MindTap C...
Statistics
ISBN:9781305504912
Author:Frederick J Gravetter, Larry B. Wallnau
Publisher:Cengage Learning
Elementary Statistics: Picturing the World (7th E...
Statistics
ISBN:9780134683416
Author:Ron Larson, Betsy Farber
Publisher:PEARSON
The Basic Practice of Statistics
Statistics
ISBN:9781319042578
Author:David S. Moore, William I. Notz, Michael A. Fligner
Publisher:W. H. Freeman
Introduction to the Practice of Statistics
Statistics
ISBN:9781319013387
Author:David S. Moore, George P. McCabe, Bruce A. Craig
Publisher:W. H. Freeman