
FINANCIAL ACCOUNTING
10th Edition
ISBN: 9781259964947
Author: Libby
Publisher: MCG
expand_more
expand_more
format_list_bulleted
Related questions
Question
thumb_up100%
I need assistance on the following regarding the attached
Required:
a) Calculate the following financial ratios for 2016 and 2017
13. Debt-to-equity ratio
14. Times-interest-earned ratio
15. Operating-cash-flow-to-capital-expenditures ratio
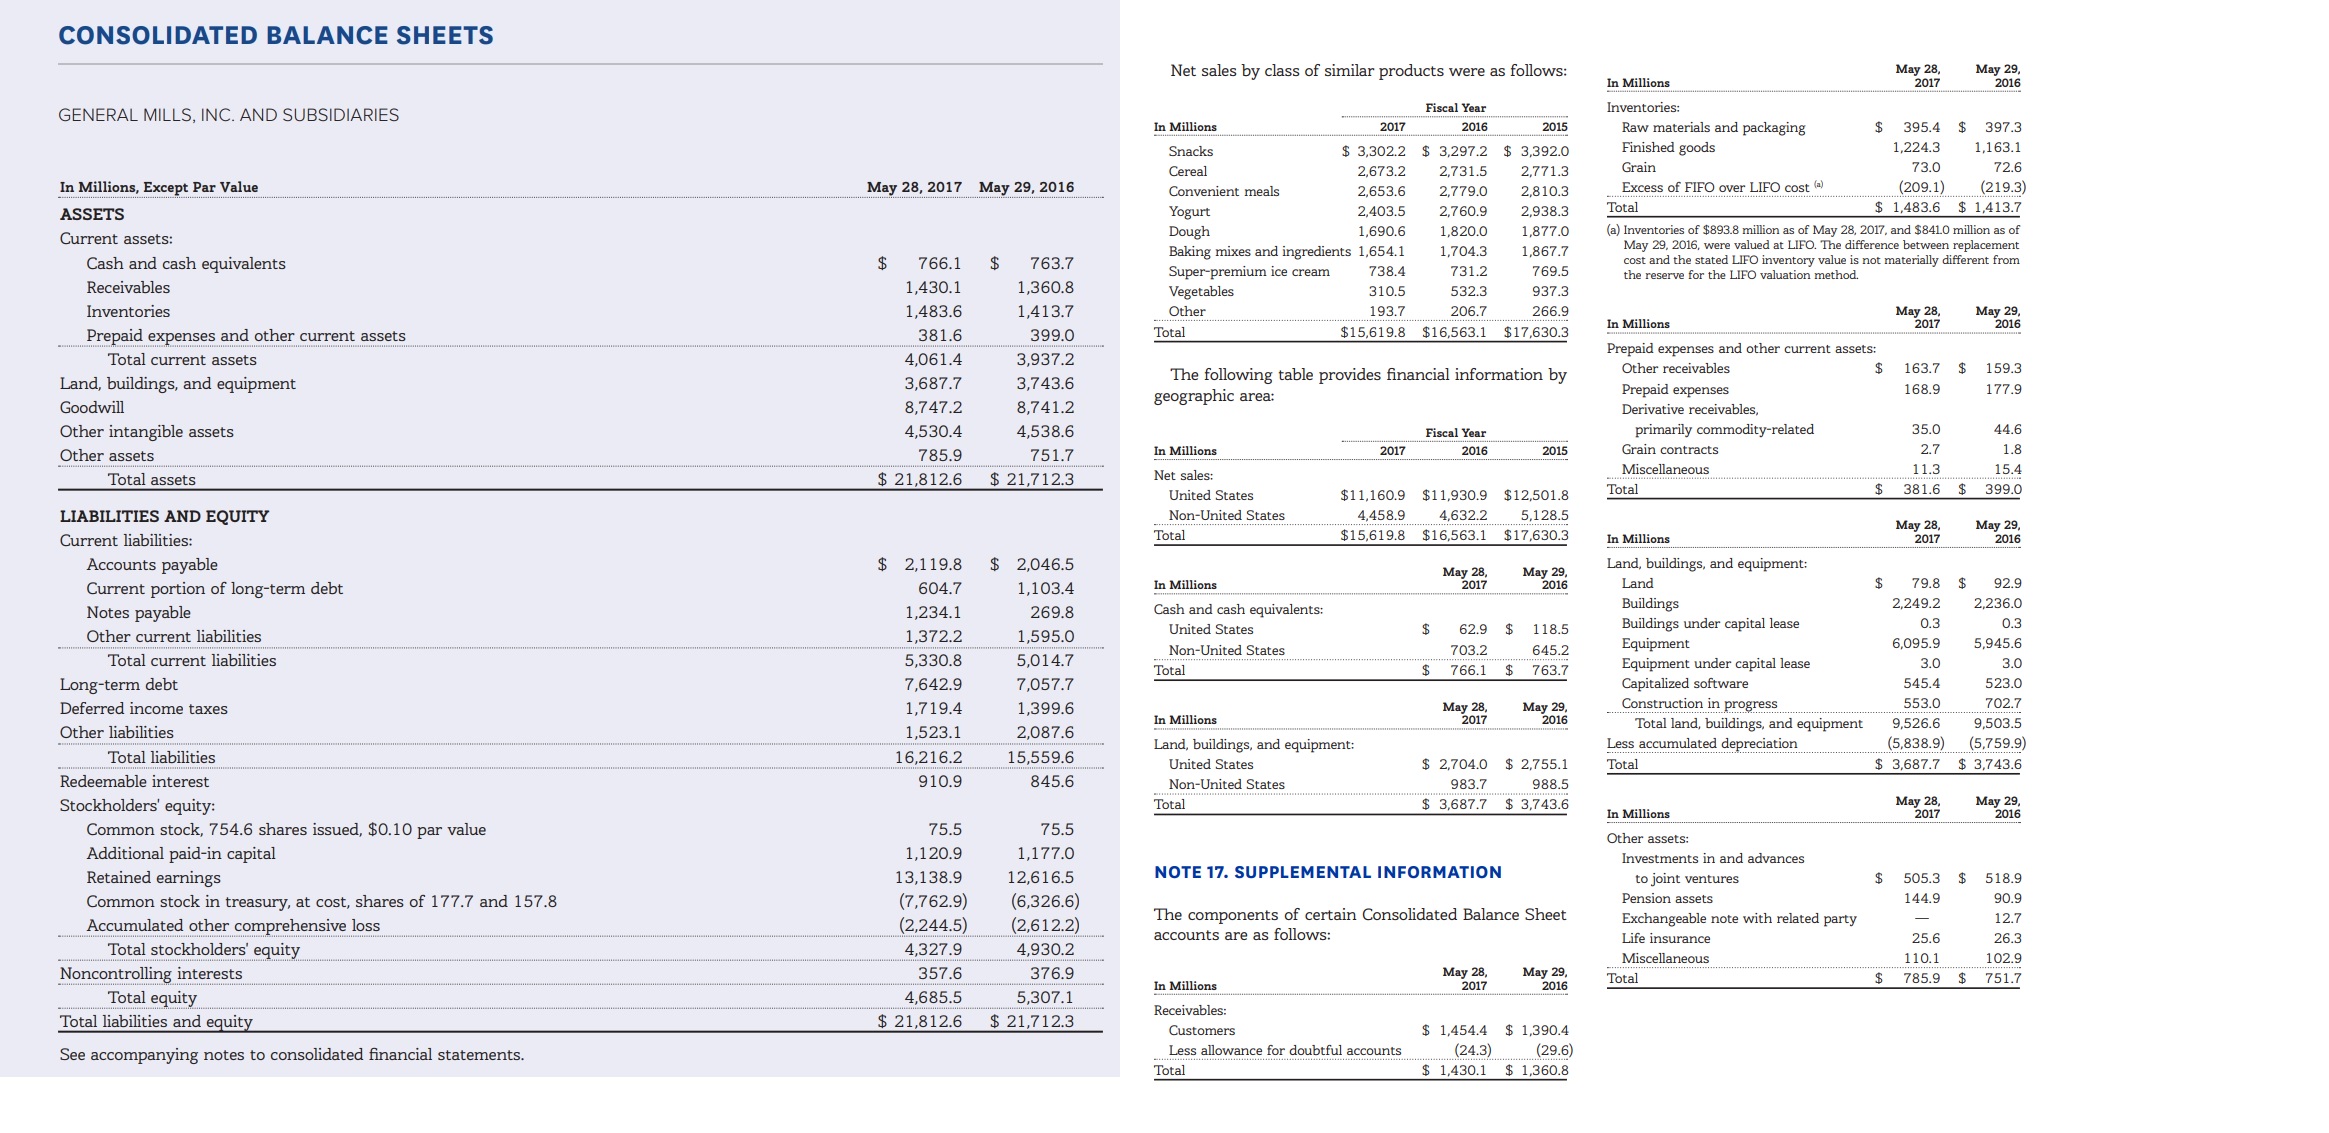

Transcribed Image Text:CONSOLIDATED BALANCE SHEETS
May 28,
2017
May 29,
2016
Net sales by class of similar products were as follows:
In Millions
Inventories:
Fiscal Year
GENERAL MILLS, INC. AND SUBSIDIARIES
Raw materials and packaging
Finished goods
In Millions
2017
2016
2015
395.4
397.3
1,224.3
1,163.1
$ 3,302.2 $ 3,297.2 $ 3,392.0
Snacks
Grain
73.0
72.6
Cereal
2,673.2
2,731.5
2,771.3
(209.1)
1,483.6 $1,413.7
(219.3)
In Millions, Except Par Value
May 29, 2016
Excess of FIFO over LIFO cost (a)
May 28, 2017
Convenient meals
2,653.6
2,779.0
2,810.3
Total
Yogurt
Dough
Baking mixes and ingredients 1,654.1
Super-premium ice cream
2,403.5
2,760.9
2,938.3
ASSETS
(a) Inventories of $893.8 million as of May 28, 2017, and $8410 million as of
May 29, 2016, were valued at LIFO. The difference between replacement
cost and the stated LIFO inventory value is not materially different from
the reserve for the LIFO valuation method.
1,690.6
1,820.0
1,877.0
Current assets:
1,867.7
1,704.3
Cash and cash equivalents
$
763.7
1,360.8
$
766.1
738.4
731.2
769.5
Receivables
1,430.1
Vegetables
310.5
532.3
937.3
Мay 29,
2016
Inventories
1,483.6
1,413.7
Мay 28,
2017
Other
193.7
206.7
266.9
In Millions
$15,619.8
$16,563.1 $17,630.3
Total
Prepaid expenses and other current assets
381.6
399.0
Prepaid expenses and other current assets:
Total current assets
4,061.4
3,937.2
163.7
Other receivables
159.3
The following table provides financial information by
geographic area:
Land, buildings, and equipment
3,687.7
3,743.6
Prepaid expenses
168.9
177.9
Goodwill
8,747.2
8,741.2
Derivative receivables,
primarily commodity-related
Grain contracts
Other intangible assets
35.0
44.6
4,530.4
4,538.6
Fiscal Year
2.7
1.8
In Millions
2017
2016
2015
Other assets
785.9
751.7
Miscellaneous
11.3
15.4
Net sales:
Total assets
$ 21,812.6
$ 21,712.3
381.6 $
Total
399.0
$11,160.9 $11,930.9 $12,501.8
United States
4,632.2
LIABILITIES AND EQUITY
Non-United States
4,458.9
5,128.5
May 28,
2017
Мay 29,
2016
$15,619.8 $16,563.1
$17,630.3
Total
In Millions
Current liabilities:
Land, buildings, and equipment
Accounts payable
$ 2,119.8
2,046.5
Мay 28,
2017
May 29,
2016
$
Land
79.8
92.9
In Millions
Current portion of long-term debt
Notes payable
604.7
1,103.4
2,236.0
Buildings
Buildings under capital lease
Equipment
Equipment under capital lease
Capitalized software
Construction in progress
Total land, buildings, and equipment
Less accumulated depreciation
2,249.2
Cash and cash equivalents:
1,234.1
269.8
0.3
0.3
United States
$
62.9
$
118.5
Other current liabilities
1,372.2
1,595.0
6,095.9
5,945.6
Non-United States
703.2
645.2
Total current liabilities
5,330.8
5,014.7
3.0
3.0
Total
766.1
763.7
Long-term debt
7,057.7
7,642.9
545.4
523.0
553.0
702.7
Мay 28,
2017
Deferred income taxes
1,719.4
1,399.6
Мay 29,
2016
In Millions
9,526.6
9,503.5
Other liabilities
2,087.6
1,523.1
Land, buildings, and equipment:
(5,838.9)
(5,759.9)
Total liabilities
16,216.2
15,559.6
$ 2,704.0
$ 2,755.1
Total
3,687.7
3,743.6
United States
Redeemable interest
910.9
845.6
Non-United States
983.7
988.5
May 28,
2017
May 29,
2016
Stockholders' equity:
$ 3,687.7
$ 3,743.6
Total
In Millions
Common stock, 754.6 shares issued, $0.10 par value
Additional paid-in capital
75.5
75.5
Other assets:
1,120.9
1,177.0
Investments in and advances
NOTE 17. SUPPLEMENTAL INFORMATION
Retained earnings
13,138.9
12,616.5
505.3 $
to joint ventures
518.9
(6,326.6)
(2,612.2)
Pension assets
(7,762.9)
144.9
90.9
Common stock in treasury, at cost, shares of 177.7 and 157.8
The components of certain Consolidated Balance Sheet
accounts are as follows:
Exchangeable note with related party
12.7
(2,244.5)
Accumulated other comprehensive loss
Total stockholders' equity
Life insurance
25.6
26.3
4,327.9
4,930.2
Miscellaneous
110.1
102.9
Noncontrolling interests
Total equity
Total liabilities and equity
Мay 28,
2017
357.6
376.9
May 29,
2016
Total
785.9
751.7
In Millions
4,685.5
5,307.1
Receivables:
$ 21,712.3
$21,812.6
$ 1,454.4
(24.3)
$ 1,430.1 $ 1,360.8
$ 1,390.4
Customers
(29.6)
Less allowance for doubtful accounts
See accompanying notes to consolidated financial statements.
Total
Transcribed Image Text:Fiscal Year
2015 (a)
In Millions, Except Per Share Data, Percentages and Ratios
2017
2016
2014
2013
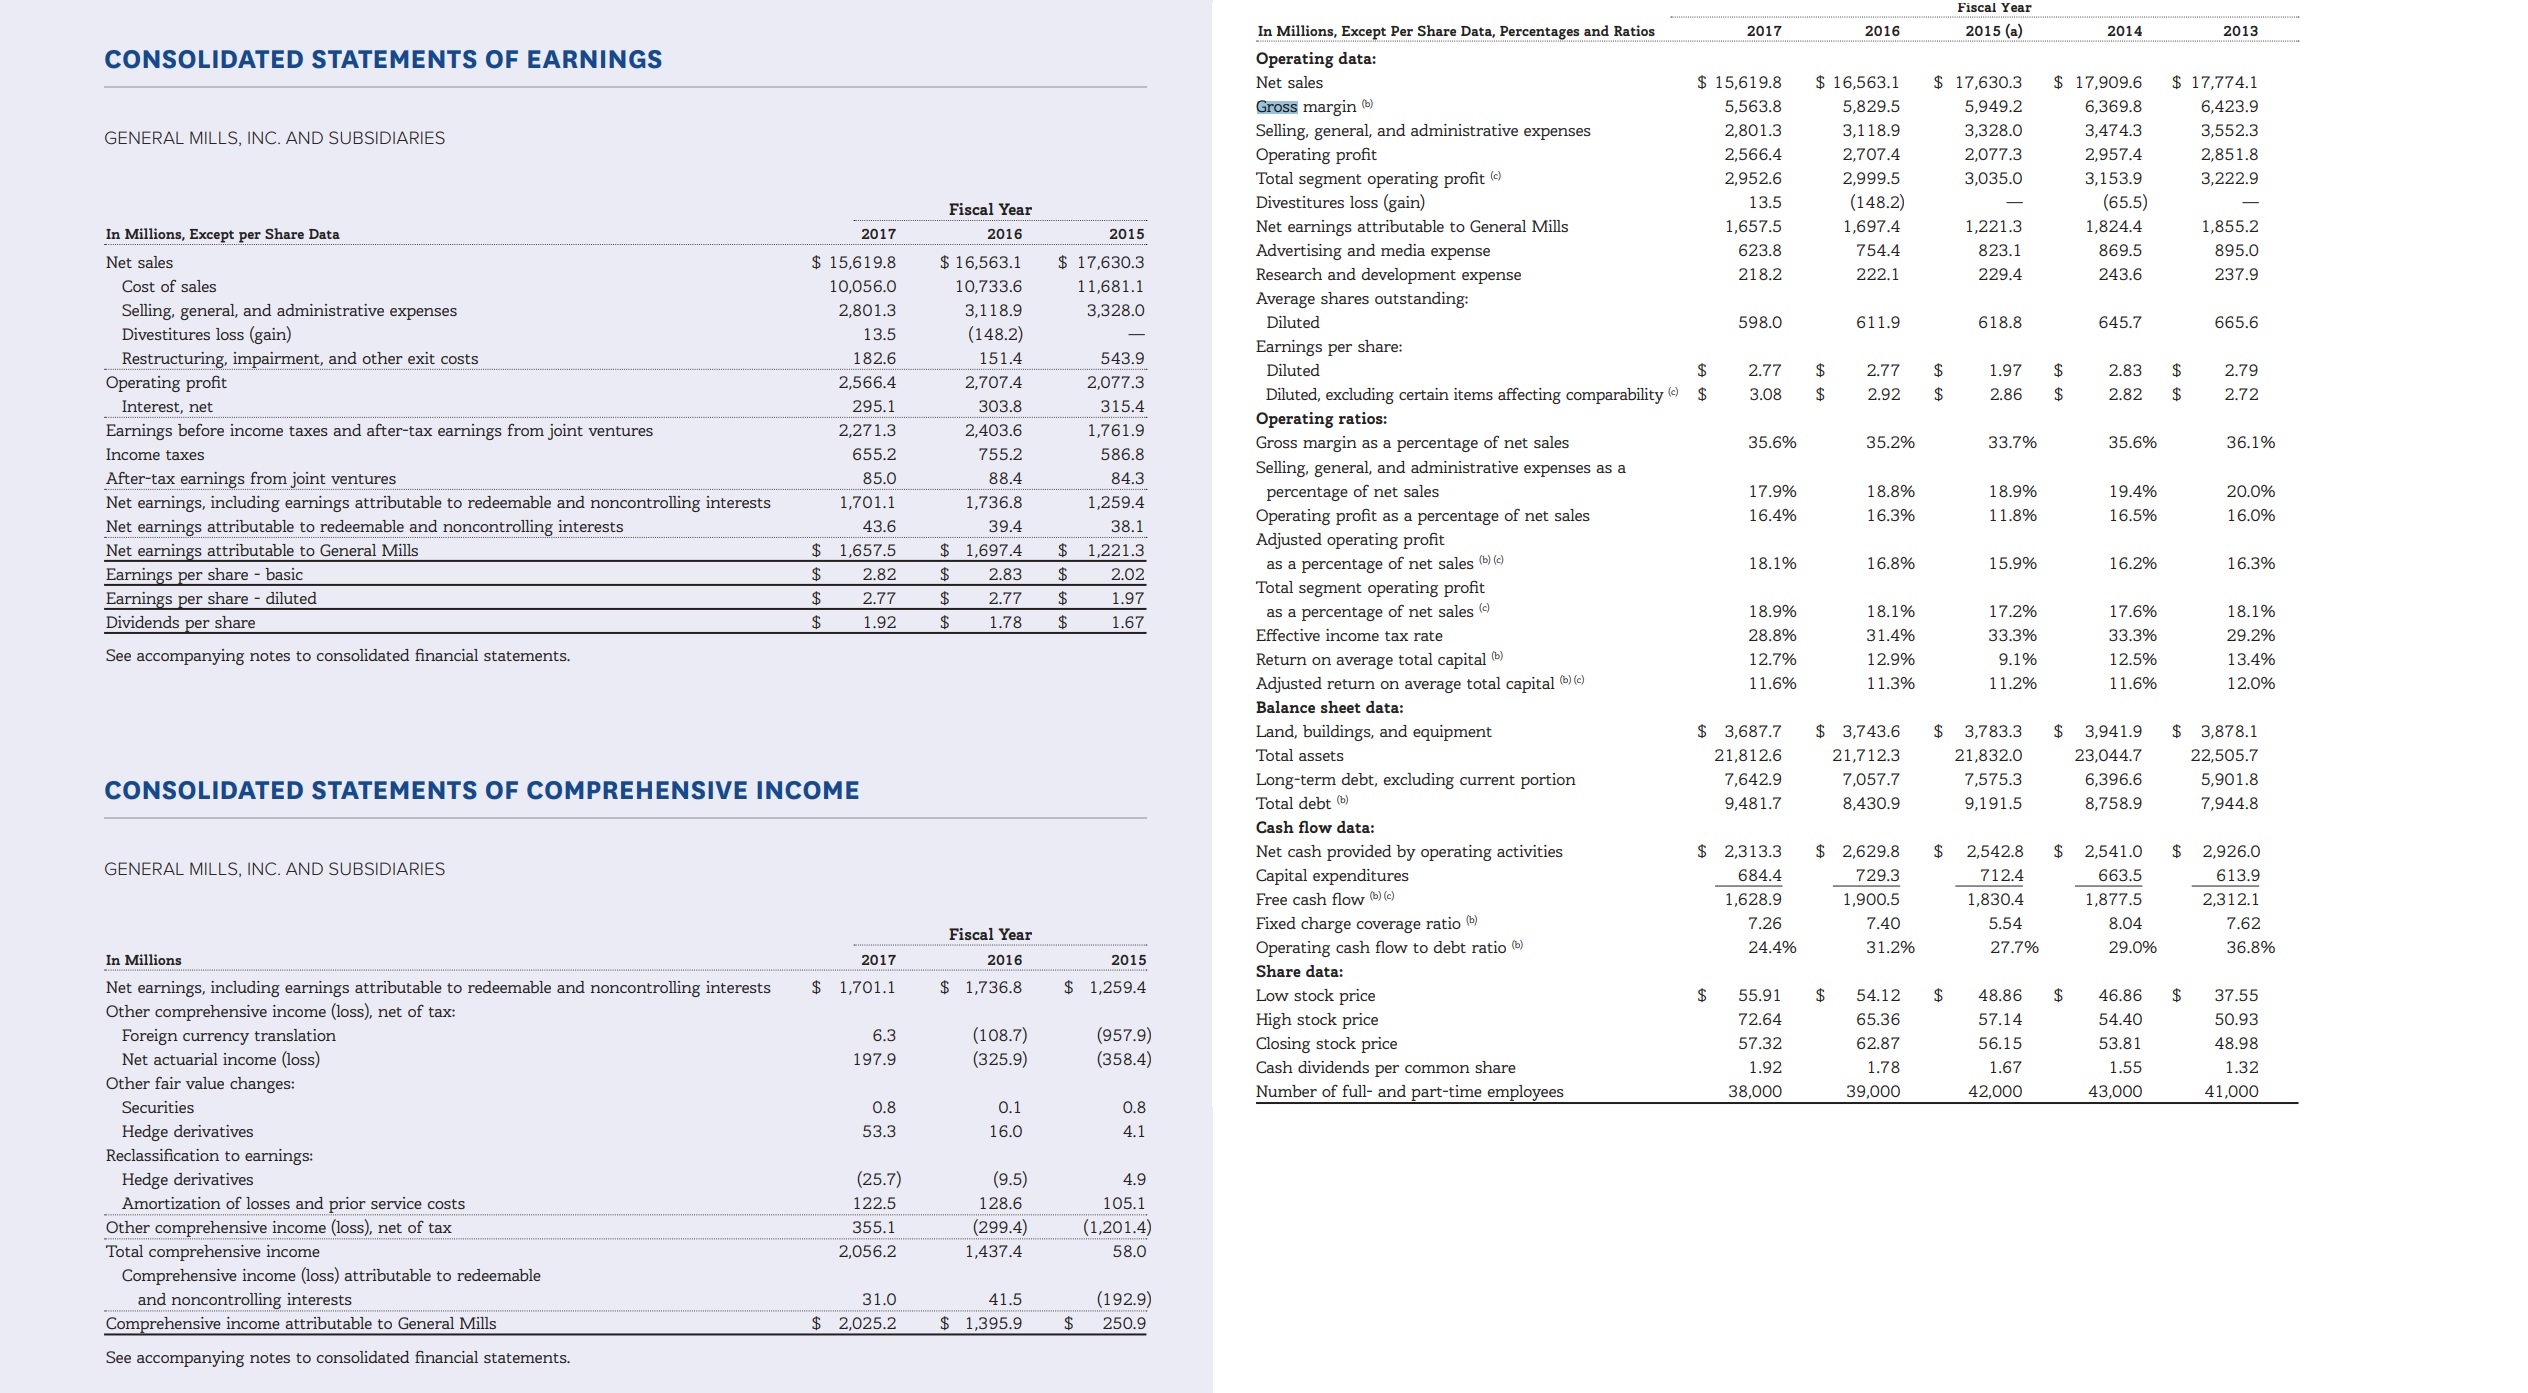
CONSOLIDATED STATEMENTS OF EARNINGS
Operating data:
$ 17,630.3
$ 17,774.1
$15,619.8
$ 16,563.1
17,909.6
Net sales
Gross margin b)
Selling, general, and administrative expenses
Operating profit
Total segment operating profit (e
Divestitures loss (gain)
Net earnings attributable to General Mills
Advertising and media expense
Research and development expense
5,563.8
5,829.5
5,949.2
6,369.8
6,423.9
3,328.0
2,801.3
3,118.9
3,474.3
3,552.3
GENERAL MILLS, INC. AND SUBSIDIARIES
2,566.4
2,707.4
2,077.3
2,957.4
2,851.8
2,952.6
2,999.5
3,035.0
3,153.9
3,222.9
(148.2)
(65.5)
13.5
Fiscal Year
1,657.5
1,697.4
1,221.3
1,824.4
1,855.2
In Millions, Except per Share Data
2017
2016
2015
754.4
623.8
823.1
869.5
895.0
$ 17,630.3
Net sales
$ 15,619.8
$ 16,563.1
243.6
218.2
222.1
229.4
237.9
Cost of sales
10,056.0
10,733.6
11,681.1
Average shares outstanding:
Selling, general, and administrative expenses
Divestitures loss (gain)
Restructuring, impairment, and other exit costs
Operating profit
3,118.9
3,328.0
2,801.3
Diluted
598.0
611.9
618.8
645.7
665.6
(148.2)
13.5
Earnings per share:
182.6
151.4
543.9
$
$
Diluted
2.77
2.77
1.97
2.83
2.79
2,566.4
2,707.4
2,077.3
Diluted, excluding certain items affecting comparability $
Operating ratios:
Gross margin as a percentage of net sales
$
3.08
2.92
$
2.86
$
2.82
2.72
$
Interest, net
295.1
303.8
315.4
Earnings before income taxes and after-tax earnings from joint ventures
2,271.3
2,403.6
1,761.9
35.6%
33.7%
35.2%
35.6%
36.1%
655.2
586.8
Income taxes
755.2
Selling, general, and administrative expenses as a
After-tax earnings from joint ventures
Net earnings, including earnings attributable to redeemable and noncontrolling interests
Net earnings attributable to redeemable and noncontrolling interests
85.0
88.4
84.3
percentage of net sales
Operating profit as a percentage of net sales
Adjusted operating profit
19.4%
17.9%
18.8%
18.9%
20.0%
1,701.1
1,736.8
1,259.4
16.3%
11.8%
16.4%
16.5%
16.0%
43.6
39.4
38.1
$ 1,697.4
$ 1,657.5
Net earnings attribut able to General Mills
1,221.3
as a percentage of net sales (b) (c)
Total segment operating profit
18.1%
16.8%
15.9%
16.2%
16.3%
Earnings per share basic
Earnings per share diluted
Dividends per share
$
2.82
2.83
2.02
$
2.77
2.77
1.97
$
as a percentage of net sales
Effective income tax rate
18.9%
18.1%
17.2%
17.6%
18.1%
$
1.92
1.78
1.67
$
$
28.8%
31.4%
33.3%
33.3%
29.2%
See accompanying notes to consolidated financial statements.
Return on average total capital
12.7%
12.9%
9.1%
12.5%
13.4%
Adjusted return on average total capital b)e)
11.6%
11.3%
11.2%
11.6%
12.0%
Balance sheet data:
$ 3,687.7
Land, buildings, and equipment
Total assets
$3,743.6
$
3,941.9
3,878.1
3,783.3
21,812.6
23,044.7
21,712.3
21,832.0
22,505.7
6,396.6
Long-term debt, excluding current portion
7,642.9
7,057.7
7,575.3
5,901.8
CONSOLIDATED STATEMENTS OF COMPREHENSIVE INCOME
Total debt (b)
9,481.7
8,430.9
9,191.5
8,758.9
7,944.8
Cash flow data:
$ 2,313.3
$
2,542.8
712.4
$
2,926.0
613.9
$ 2,629.8
$ 2,541.0
Net cash provided by operating activities
Capital expenditures
Free cash flow (b) (e)
GENERAL MILLS, INC. AND SUBSIDIARIES
729.3
684.4
663.5
1,628.9
1,900.5
1,830.4
1,877.5
2,312.1
Fixed charge coverage ratio ()
Operating cash flow to debt ratio (b)
7.26
7.40
5.54
8.04
7.62
Fiscal Year
24.4%
31.2%
27.7%
29.0%
36.8%
2016
In Millions
2017
2015
Share data:
$ 1,701.1
$ 1,259.4
1,736.8
Net earnings, including earnings attributable to redeemable and noncontrolling interests
Other comprehensive income (loss), net of tax:
Foreign currency translation
Net actuarial income (loss)
Low stock price
$
$
55.91
54.12
48.86
46.86
37.55
High stock price
Closing stock price
72.64
65.36
57.14
54.40
50.93
(957.9)
(358.4)
(108.7)
(325.9)
6.3
57.32
62.87
56.15
53.81
48.98
197.9
Cash dividends per common share
1.92
1.78
1.67
1.55
1.32
Other fair value changes:
Number of full- and part-time employees
38,000
39,000
42,000
43,000
41,000
Securities
0.8
0.1
0.8
Hedge derivatives
Reclassification to earnings:
Hedge derivatives
53.3
16.0
4.1
(25.7)
(9.5)
4.9
Amortization of losses and prior service costs
Other comprehensive income (loss), net of tax
Total comprehensive income
Comprehensive income (loss) attributable to redeemable
122.5
128.6
105.1
(299.4)
(1,201.4)
355.1
2,056.2
1,437.4
58.0
(192.9)
and noncontrolling interests
Comprehensive income attributable to General Mills
31.0
41.5
$ 2,025.2
1,395.9
250.9
See accompanying notes to consolidated financial statements.
Expert Solution
This question has been solved!
Explore an expertly crafted, step-by-step solution for a thorough understanding of key concepts.

This is a popular solution

Trending nowThis is a popular solution!

Step by stepSolved in 2 steps with 2 images

Knowledge Booster


Learn more about
Need a deep-dive on the concept behind this application? Look no further. Learn more about this topic, accounting and related others by exploring similar questions and additional content below.Similar questions
- What amounts did Target report for the following items for the year ended January 30, 2016?a. Total Revenuesb. Income from current operationsc. Net income or net lossd. Total assetse. Total equityarrow_forwardRequired: For each of the following accounts, what amount will Voltac report on its 2024 financial statements? a. Inventory b. Cost of goods sold c. Sales d. Accounts receivable e. Accounts payable f. Casharrow_forwardWith a given information below: (A) Prepare Income Statement and Balance Sheet in the Year 2020. (B) Analyze Income Statement and Balance Sheet in the Year 2020 Vertically. (C) Compute Financial Ratios: (1) ROE, (2) ROA, (3) Average Collection Period, (4) Debt to Asset, (5) Debt to Equity, (6) Time Interest Earned, (7) Total Assets Turnover, (8) Operating Profit Margin, (9) Return On Common Equity (ROCE), (10) Net Working Capital Ratio, (11) Quick Ratio, (12) Current Ratio. Cash $6,000 Sales $100,000 Utility Expense $8,000 Buildings $65,000 Common Stock $45,000 Accounts Payable $12,000 Supplies $4,000 Cost of Goods Sold $58,000 Interest Expense $5,000 Additional Paid in Capital $20,000 Bonds Payable $40,000 Supplies Expense $3,000 Salaries Expense $16,000 Accounts Receivable $10,000 Inventories $45,000 Retained Earnings $5,000 (beg. bal.) Income Tax Rate 20%arrow_forward
- The image uploaded is the calculation of Societe Generale Profitability ratios, shorter liquidity ratios, long-term liquidity ratios, and investment ratios for 2020, 2021, 2022. A base year of 2019 was also added. Evaluate the financial performance by comparing the three (3) years' financial performance that is 2020, 2021, and 2022 I have provided in the table with the base year.arrow_forwardIndustry benchmarks can be drawn from quantitative financial ratio information calculated from individual firms. All of the following are key financial ratios that can help establish benchmarks except: Group of answer choices D. Funds from operations/total assets A. EBITDA C. Long-term debt/capital B. Operating income/salesarrow_forwardBelow are three independent scenarios concerning the GST account balance and the effect on the Statement of Financial Position in the previous year (2023) and the current year (2024). SFP as at 31/3/2023 Scenario 1 GST liability of $267 Scenario 2 GST asset of $267 Scenario 3 GST asset of $267 SFP as at 31/3/2024 GST asset of $769 GST asset of $769 GST liability of $769 Required: Correctly insert the opening and closing balances into the three independent GST general ledger accounts provided in the answer booklet. Balance each of the three GST general ledger accounts and insert the opening balance for 1 April 2024.arrow_forward
- Required: (a) You are required to calculate the following ratios:(i) Gross profit margin(ii) Operating profit margin(iii) Expenses to sales(iv) Return on Capital Employed(v) Asset turnover(vi) Non-current asset turnover(vii) Current Ratio(viii) Quick Ratio(ix) Inventory days(x) Receivables days(xi) Payable days(xii) Interest cover (b) In light of your calculations comment on the performance of the company over thelast two years.arrow_forwardPresent formulas and examples of the following financial ratios (Financial ratios)a. gross marginb. profit margin on salesc. return on equity (ROE)arrow_forwardRequired: Compute the following ratios for 2020: 1. Current Ratio 2. Quick Ratio 3. Receivable Turnover 4. Average Collection Period 5. Inventory Turnover 6. Average Sales Period 7. Working Capital 8. Debt Ratio 9. Equity Ratio 10. Debt to Equity Ratio 11. Time Interest Earned 12. Gross Profit Ratio 13. Operating Profit Margin 14. Net Profit Margin 15. Return on Assetsarrow_forward
- Calculate the following profitability ratios for 2018 and 2019. a. Gross profit ratio b. Return on assets c. Profit margin d. assets turnoverarrow_forwardplease answer within the format by providing formula the detailed workingPlease provide answer in text (Without image)Please provide answer in text (Without image)Please provide answer in text (Without image)arrow_forwardAccounting Questionarrow_forward
arrow_back_ios
SEE MORE QUESTIONS
arrow_forward_ios
Recommended textbooks for you
 AccountingAccountingISBN:9781337272094Author:WARREN, Carl S., Reeve, James M., Duchac, Jonathan E.Publisher:Cengage Learning,
 Accounting Information SystemsAccountingISBN:9781337619202Author:Hall, James A.Publisher:Cengage Learning,
 Horngren's Cost Accounting: A Managerial Emphasis...AccountingISBN:9780134475585Author:Srikant M. Datar, Madhav V. RajanPublisher:PEARSON
 Intermediate AccountingAccountingISBN:9781259722660Author:J. David Spiceland, Mark W. Nelson, Wayne M ThomasPublisher:McGraw-Hill Education
 Financial and Managerial AccountingAccountingISBN:9781259726705Author:John J Wild, Ken W. Shaw, Barbara Chiappetta Fundamental Accounting PrinciplesPublisher:McGraw-Hill Education
Accounting
Accounting
ISBN:9781337272094
Author:WARREN, Carl S., Reeve, James M., Duchac, Jonathan E.
Publisher:Cengage Learning,
Accounting Information Systems
Accounting
ISBN:9781337619202
Author:Hall, James A.
Publisher:Cengage Learning,
Horngren's Cost Accounting: A Managerial Emphasis...
Accounting
ISBN:9780134475585
Author:Srikant M. Datar, Madhav V. Rajan
Publisher:PEARSON
Intermediate Accounting
Accounting
ISBN:9781259722660
Author:J. David Spiceland, Mark W. Nelson, Wayne M Thomas
Publisher:McGraw-Hill Education
Financial and Managerial Accounting
Accounting
ISBN:9781259726705
Author:John J Wild, Ken W. Shaw, Barbara Chiappetta Fundamental Accounting Principles
Publisher:McGraw-Hill Education