
Corporate Fin Focused Approach
5th Edition
ISBN: 9781285660516
Author: EHRHARDT
Publisher: Cengage
expand_more
expand_more
format_list_bulleted
Related questions
Question
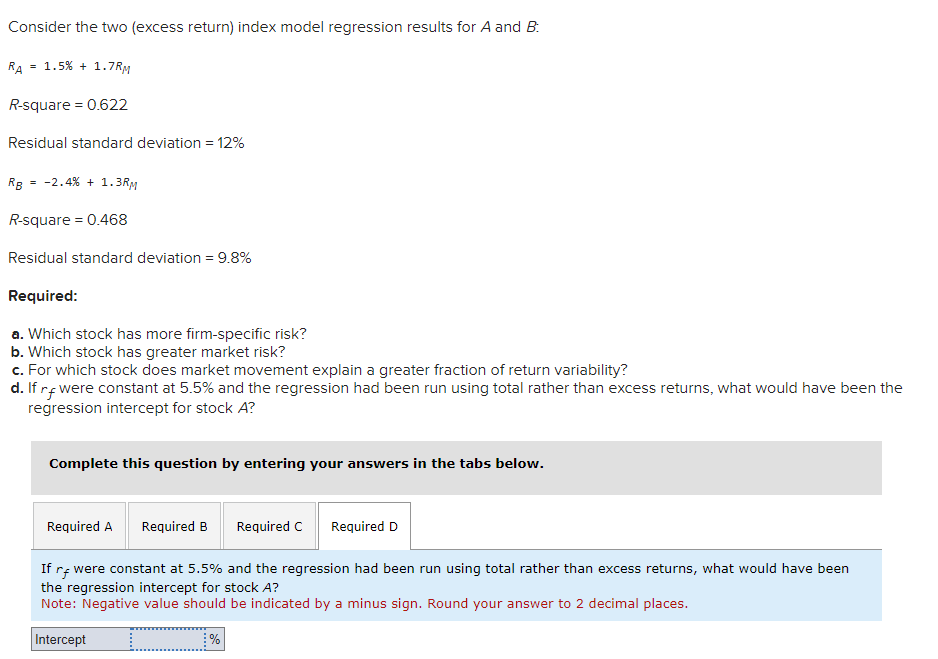

Transcribed Image Text:Consider the two (excess return) index model regression results for A and B.
RA
= 1.5% + 1.7RM
R-square = 0.622
Residual standard deviation = 12%
RB
= -2.4 % +1.3RM
R-square=0.468
Residual standard deviation = 9.8%
Required:
a. Which stock has more firm-specific risk?
b. Which stock has greater market risk?
c. For which stock does market movement explain a greater fraction of return variability?
d. If rf were constant at 5.5% and the regression had been run using total rather than excess returns, what would have been the
regression intercept for stock A?
Complete this question by entering your answers in the tabs below.
Required A Required B Required C Required D
If rf were constant at 5.5% and the regression had been run using total rather than excess returns, what would have been
the regression intercept for stock A?
Note: Negative value should be indicated by a minus sign. Round your answer to 2 decimal places.
Intercept
%
Expert Solution
This question has been solved!
Explore an expertly crafted, step-by-step solution for a thorough understanding of key concepts.

This is a popular solution

Trending nowThis is a popular solution!

Step by stepSolved in 2 steps

Knowledge Booster

Similar questions
- Calculate the correlation coefficient between Blandy and the market. Use this and the previously calculated (or given) standard deviations of Blandy and the market to estimate Blandy’s beta. Does Blandy contribute more or less risk to a well-diversified portfolio than does the average stock? Use the SML to estimate Blandy’s required return.arrow_forwardConsider the two (excess return) index model regression results for A and B: RA = 0.8% + 1RM R-square = 0.588 Residual standard deviation = 10.8% RB = –1.2% + 0.7RM R-square = 0.452 Residual standard deviation = 9% a. Which stock has more firm-specific risk? multiple choice A. Stock A B. Stock B Which stock has greater market risk? multiple choice 2 A. Stock A B. Stock B b. For which stock does market movement has a greater fraction of return variability? multiple choice 3 A. Stock A B. Stock B c. If rf were constant at 4.5% and the regression had been run using total rather than excess returns, what would have been the regression intercept for stock A? (Negative value should be indicated by a minus sign. Round your answer to 2 decimal places.)arrow_forwardConsider the two (excess return) index model regression results for A and B: RA = 0.8% + 1RM R-square = 0.588 Residual standard deviation = 10.8% RB = –1.2% + 0.7RM R-square = 0.452 Residual standard deviation = 9% a. Which stock has more firm-specific risk? A. Stock A B. Stock B Which stock has greater market risk? A. Stock A B. Stock B b. For which stock does market movement has a greater fraction of return variability? A. Stock A B. Stock B c. If rf were constant at 4.5% and the regression had been run using total rather than excess returns, what would have been the regression intercept for stock A? (Negative value should be indicated by a minus sign. Round your answer to 2 decimal places.)arrow_forward
- d. Interpret your results in (c) above, assuming that the historical average return of 8.5% from the stock is a good benchmark. e. Critically evaluate the strengths and weaknesses of applying the implied rate of return from the RIVM as a proxy of the expected return.arrow_forwardWhen working with the CAPM, which of the following factors can be determined with the most precision? a. The beta coefficient of "the market," which is the same as the beta of an average stock. b. The beta coefficient, bi, of a relatively safe stock. c. The market risk premium (RPM). d. The most appropriate risk-free rate, rRF. e. The expected rate of return on the market, rM.arrow_forwardThe slope of a regression line when the return on an individual stock's returns are regressed on the return on the market portfolio, would be: OAR BR-₁ B OC none of the answers listed here. ODO imarrow_forward
- Consider the following regression Pt * - Pt = .07(1.4) + .4*Pt (3.6) + et where Pt * is Shiller’s ex post price of a stock, Pt is the actual price and t-ratios are in brackets. Explain in words and analytically what the dependent variable Pt * - Pt should be equal to under the efficient markets theory. Hence interpret the regression. Does it support the efficient markets theory?arrow_forwardpm.2arrow_forwardGive typing answer with explanation and conclusionarrow_forward
- Exercises: a. The standard deviation of returns is 0.30 for Stock A and 0.20 for Stock B. The covariance between the returns of A and B is 0.006. The correlation of returns between A and B is: b. Explain the differences between systemic risk and unsystematic risk, give additional examples c. Compare and contrast the Capital Market Line and Security Market Line d. The covariance of the market's returns with the stock's returns is 0.008. The standard deviation of the market's returns is 0.08, and the standard deviation of the stock's returns is 0. 11. What is the correlation coefficient of the returns of the stock and the returns of the market? e. According to the CAPM, what is the required rate of return for a stock with a beta of 0.7, when the risk-free rate is 7% and the expected market rate of return is 14%arrow_forwarda) Discuss the difference between a price-weighted index and a value-weighted index. Give one example for the price-weighted index and one example for the value-weighted index and discuss any problems/advantages associated with the specific indices. b) We assume that investors use mean-variance utility: U = E(r) – 0.5 × Ao², where E(r) is the expected return, A is the risk aversion coefficient and o? is the variance of returns. Given that the optimal proportion of the risky asset in the complete port- folio is given by the equation y* = E , where r; is the risk-free rate, E(rp) is the expected returm of the risky portfolio, o, is variance of returns, and A is the risk aversion coefficient. For each of the variables on the right side of the equation, discuss the impact of the variable's effect on y* and why the nature of the relationship makes sense intuitively. Assume the investor is risk averse. Aoarrow_forwardAn ideal value-relevant attribute is one for which the correlation coefficient of the values of the attribute and the stock prices is Group of answer choices a. +2.0 b. zero c. +1.0 d. -1.0arrow_forward
arrow_back_ios
SEE MORE QUESTIONS
arrow_forward_ios
Recommended textbooks for you
 Intermediate Financial Management (MindTap Course...FinanceISBN:9781337395083Author:Eugene F. Brigham, Phillip R. DavesPublisher:Cengage Learning
Intermediate Financial Management (MindTap Course...
Finance
ISBN:9781337395083
Author:Eugene F. Brigham, Phillip R. Daves
Publisher:Cengage Learning