MATLAB: An Introduction with Applications
6th Edition
ISBN: 9781119256830
Author: Amos Gilat
Publisher: John Wiley & Sons Inc
expand_more
expand_more
format_list_bulleted
Concept explainers
Topic Video
Question
thumb_up100%

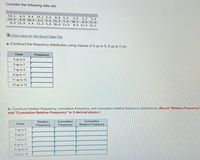
Transcribed Image Text:Consider the following data set:
14.1
13.2
8.3 11.9 3.4 11.2 5.6 10.4 11.5
4.5
9.4 14.1 3.4
8.8 5.5
5.6
9.8 10.5 3.2 5.5 11.5 7.4 10.2
3.2 5.5
6.6 11.6
8.6 11.4 14.1
E Click here for the Excel Data File
a. Construct the frequency distribution using classes of 3 up to 5, 5 up to 7, etc.
Class
Frequency
3 up to 5
5 up to 7
7 up to 9
9 up to 11
11 up to 13
13 up to 15
b. Construct relative frequency, cumulative frequency, and cumulative relative frequency distributions. (Round "Relative Frequency"
and "Cumulative Relative Frequency" to 2 decimal places.)
Relative
Cumulative
Cumulative
Class
Frequency
Frequency
Relative Frequency
3 up to 5
5 up to 7
7 up to 9
9 up to 11
11 up to 13
13 up to 15

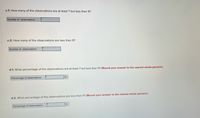
Transcribed Image Text:c-1. How many of the observations are at least 7 but less than 9?
Number of observations
c-2. How many of the observations are less than 9?
Number of observations
d-1. What percentage of the observations are at least 7 but less than 9? (Round your answer to the nearest whole percent.)
%
Percentage of observations
d-2. What percentage of the observations are less than 9? (Round your answer to the nearest whole percent.)
%
Percentage of observations
Expert Solution
This question has been solved!
Explore an expertly crafted, step-by-step solution for a thorough understanding of key concepts.
This is a popular solution
Trending nowThis is a popular solution!
Step by stepSolved in 4 steps

Knowledge Booster
Learn more about
Need a deep-dive on the concept behind this application? Look no further. Learn more about this topic, statistics and related others by exploring similar questions and additional content below.Similar questions
- 11arrow_forwardThe following set of data represents the number of orders filled by a national-chain restaurant during a two week period. Construct a five number summary for the the data. 66, 75, 68, 89, 86, 73, 67, 75, 75, 82, 85, 74, 67, 61 (Round to the nearest hundredth, if needed). Min _________________ Lower Quartile _________________ Median __________________ Upper Quartile _________________ Maximum __________________ What is the range and the interquartile range (IQR)? Range __________________ Interquartile Range (IQR) ___________________arrow_forwardCalculate the coefficient of skewness for the data referring to 50 students. 173.5 171.4 178.2 165.7 180.0 174.6 176.0 168.5 180.1 165.9169.0 175.4 176.5 164.0 167.5 158.4 168.0 172.8 172.5 173.2170.5 180.5 171.8 184.3 178.5 172.0 174.5 173.0 176.3 186.4167.5 165.7 165.0 178.0 177.5 181.0 179.5 174.6 173.2 172.9170.5 181.3 160.6 168.5 170.0 171.0 176.5 178.9 180.0 169.0arrow_forward
- The following refer to the following data set: 50.4 47.5 50.4 23.4 33.7 50.4 39.2 36.4 16.3 21.8 What is the arithmetic mean of this data set? mean = 37What is the median of this data set?median = 37.8What is the mode of this data set?mode = 50.4arrow_forwardWe will rank the y-values of the following data set: x y -2 -11 -0.8 -11.9 0.7 11.7 1.7 12.2 2.4 1.8 4.6 9.4 6 11.9 7.8 33.4 8.4 27 9.7 21.5 The scatterplot of the data looks like this: 123456789101112-1-2-3-4-5123456789101112131415161718192021222324252627282930313233343536-1-2-3-4-5-6-7-8-9-10-11-12-13-14 Fill in the following table: x y x-rank y-rank -2 -11 1 -0.8 -11.9 2 0.7 11.7 3 1.7 12.2 4 2.4 1.8 5 4.6 9.4 6 6 11.9 7 7.8 33.4 8 8.4 27 9 9.7 21.5 10arrow_forwardComplete the stemplot for the following data. 31 37 48 28 30 34 54 39 22 41 43 33 28 55 49 31 35 58 36 29 20 48 23 30 34 22 20 36 34 31 2# | 002238893# | 001113444566794# | 138895# |arrow_forward
- Based on the given stem and leaf, what is the last data value in the dataset? Stem 10 11 12 13 14 15 Leaf 1 0 1 62 4 23 7 5 8 9 Leaf unit = 0.1arrow_forwardWe will rank the y-values of the following data set: x y -1 0.6 -0.5 -5.2 1.7 6 2.6 7.2 3.2 11.6 5.1 15.3 6.7 7.7 8.8 17.1 9.4 22.4 10.1 13.8 Fill in the following table: x y x-rank y-rank -1 0.6 1 -0.5 -5.2 2 1.7 6 3 2.6 7.2 4 3.2 11.6 5 5.1 15.3 6 6.7 7.7 7 8.8 17.1 8 9.4 22.4 9 10.1 13.8 10arrow_forwardWe will rank the y-values of the following data set: x y -5 2.8 -2.9 -1.7 -1.2 3.9 0 2.7 1.3 -6.6 2.2 -6.9 3.3 5.9 Fill in the following table: x y x-rank y-rank -5 2.8 1 -2.9 -1.7 2 -1.2 3.9 3 0 2.7 4 1.3 -6.6 5 2.2 -6.9 6 3.3 5.9 7arrow_forward
- Find the interquartile range for the following two data sets and compare them. Test Scores for Class A 69; 96; 82; 79; 65; 74; 83; 99; 89; 67; 90; 77; 85; 98; 66; 90; 77; 69; 80; 94 Test Scores for Class B 90; 72; 80; 92; 90; 97; 92; 75; 79; 68; 70; 82; 99; 94; 78; 73; 71; 68; 95; 100 The IQR for Class A is Number The IQR for Class B is Number Judging by their IQR, more variation is found in the test scores for Class Click for Listarrow_forwardThe following data set is of the average (just treat this as a regular data set...do not over think the fact that this is a data set of averages) number of three-point shots Stephen Curry made each season of his career: 2.1 2 2.1 3.5 3.3 3.6 5.1 4.1 4.2 5.1 2.4 5.3 5.4 What is the five-number summary of this data set? a. 2, 2.4, 3.6, 5.1, 5.4 b. 1.23, 3.7, 0.33, 3.6, 2.4 c. 5.4, 5.1, 3.6, 2.4, 2 d. 2, 2.8, 3.7, 5.2, 5.4 e. None of thesearrow_forwardWe will rank the y-values of the following data set: x y 3 -7.5 4.3 6.5 4.9 -7.5 6.9 -0.1 8 4.8 9.2 -7.3 10.1 -3 10.8 2.5 11.9 -13.1 Fill in the following table: x y x-rank y-rank 3 -7.5 1 4.3 6.5 2 4.9 -7.5 3 6.9 -0.1 4 8 4.8 5 9.2 -7.3 6 10.1 -3 7 10.8 2.5 8 11.9 -13.1 9arrow_forward
arrow_back_ios
SEE MORE QUESTIONS
arrow_forward_ios
Recommended textbooks for you
 MATLAB: An Introduction with ApplicationsStatisticsISBN:9781119256830Author:Amos GilatPublisher:John Wiley & Sons Inc
 Probability and Statistics for Engineering and th...StatisticsISBN:9781305251809Author:Jay L. DevorePublisher:Cengage Learning
 Statistics for The Behavioral Sciences (MindTap C...StatisticsISBN:9781305504912Author:Frederick J Gravetter, Larry B. WallnauPublisher:Cengage Learning
 Elementary Statistics: Picturing the World (7th E...StatisticsISBN:9780134683416Author:Ron Larson, Betsy FarberPublisher:PEARSON
 The Basic Practice of StatisticsStatisticsISBN:9781319042578Author:David S. Moore, William I. Notz, Michael A. FlignerPublisher:W. H. Freeman
 Introduction to the Practice of StatisticsStatisticsISBN:9781319013387Author:David S. Moore, George P. McCabe, Bruce A. CraigPublisher:W. H. Freeman

MATLAB: An Introduction with Applications
Statistics
ISBN:9781119256830
Author:Amos Gilat
Publisher:John Wiley & Sons Inc

Probability and Statistics for Engineering and th...
Statistics
ISBN:9781305251809
Author:Jay L. Devore
Publisher:Cengage Learning

Statistics for The Behavioral Sciences (MindTap C...
Statistics
ISBN:9781305504912
Author:Frederick J Gravetter, Larry B. Wallnau
Publisher:Cengage Learning

Elementary Statistics: Picturing the World (7th E...
Statistics
ISBN:9780134683416
Author:Ron Larson, Betsy Farber
Publisher:PEARSON

The Basic Practice of Statistics
Statistics
ISBN:9781319042578
Author:David S. Moore, William I. Notz, Michael A. Fligner
Publisher:W. H. Freeman

Introduction to the Practice of Statistics
Statistics
ISBN:9781319013387
Author:David S. Moore, George P. McCabe, Bruce A. Craig
Publisher:W. H. Freeman