
ENGR.ECONOMIC ANALYSIS
14th Edition
ISBN: 9780190931919
Author: NEWNAN
Publisher: Oxford University Press
expand_more
expand_more
format_list_bulleted
Related questions
Question
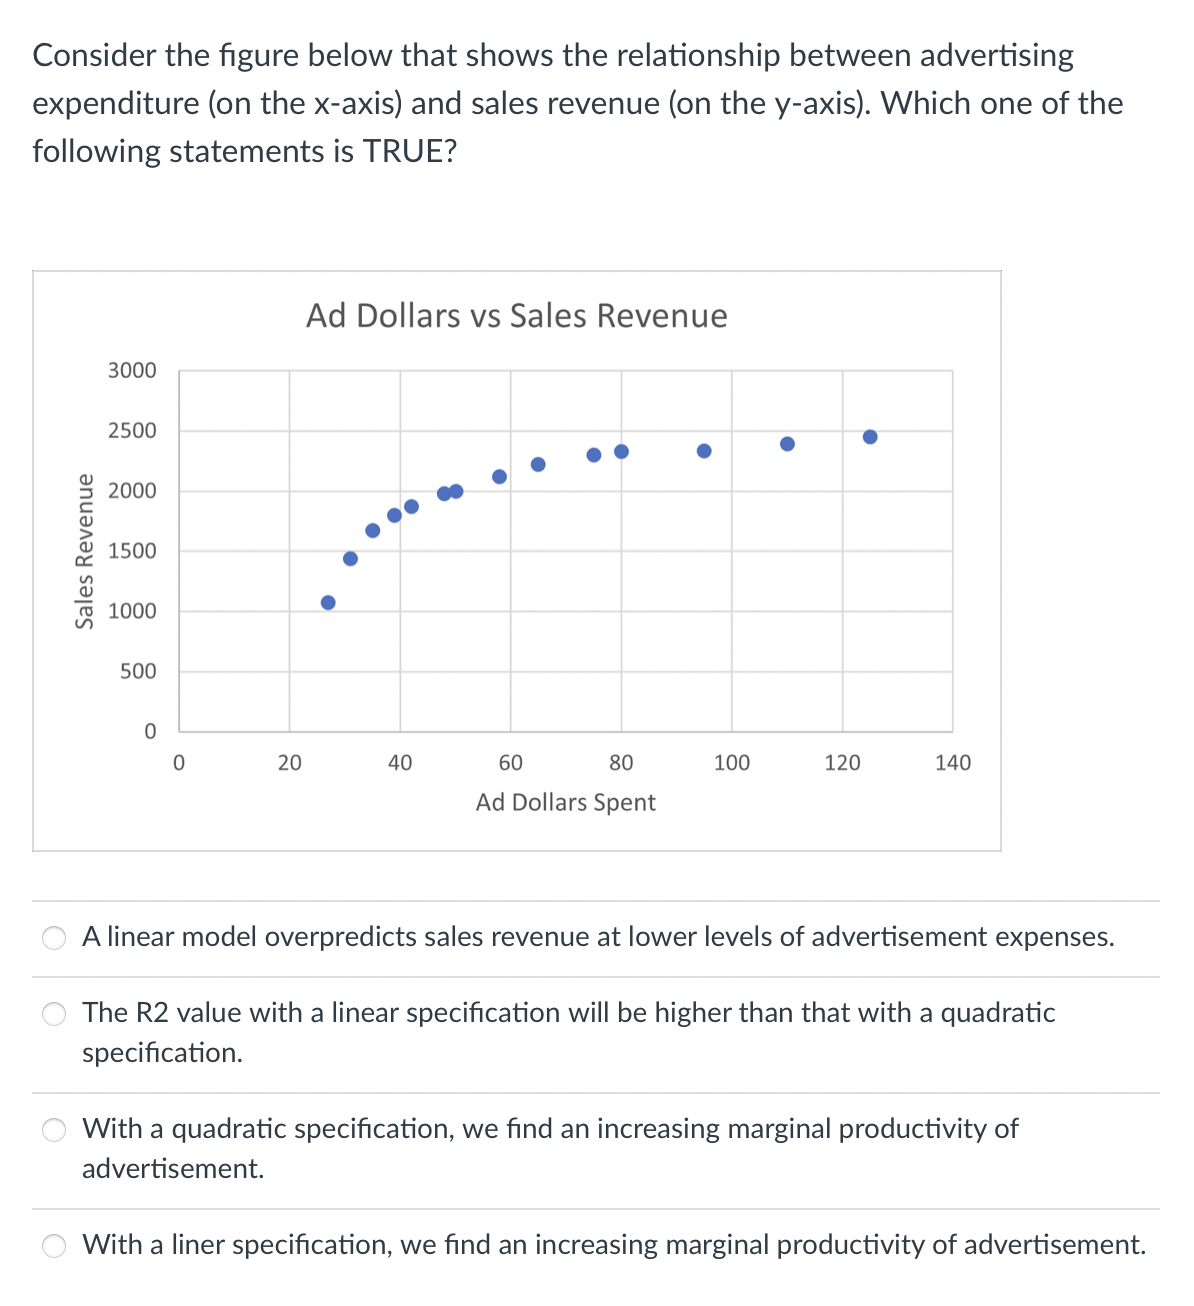

Transcribed Image Text:Consider the figure below that shows the relationship between advertising
expenditure (on the x-axis) and sales revenue (on the y-axis). Which one of the
following statements is TRUE?
Sales Revenue
3000
2500
2000
1500
1000
500
0
0
20
Ad Dollars vs Sales Revenue
40
60
80
Ad Dollars Spent
100
120
●
140
A linear model overpredicts sales revenue at lower levels of advertisement expenses.
The R2 value with a linear specification will be higher than that with a quadratic
specification.
With a quadratic specification, we find an increasing marginal productivity of
advertisement.
With a liner specification, we find an increasing marginal productivity of advertisement.
Expert Solution
This question has been solved!
Explore an expertly crafted, step-by-step solution for a thorough understanding of key concepts.

Step by stepSolved in 4 steps

Knowledge Booster


Learn more about
Need a deep-dive on the concept behind this application? Look no further. Learn more about this topic, economics and related others by exploring similar questions and additional content below.Similar questions
- Please provide the correct answer along with the calculation. Do not use ChatGPT, otherwise I will give a downvote.arrow_forwardAn analyst working for your firm provided an estimated log-linear demand function based on the natural logarithm of the quantity sold, price, and the average income of consumers. Results are summarized in the following table: SUMMARY OUTPUT Regression Statistics Multiple R R Square Adjusted R Square Standard Error Observations ANOVA Regression Residual Total Intercept LN Price LN Income df 0.968 0.937 0.933 0.003 30 SS MS F 2 0.003637484 0.001818742 202.48598 0.000242516 8.98206E-06 27 29 0.00388 Coefficients Standard Error 0.57 0.00 0.13 0.51 -0.08 0.15 t Stat 0.90 -19.50 1.13 P-value 0.37 0.00 0.27 Significance F 5.55598E-17 Lower 95% -0.65 -0.09 -0.12 How would a 4 percent increase in income impact the demand for your product? Demand would increase by 60 percent. Demand would increase by 0.6 percent. Demand would decrease by 60 percent. Demand would decrease by 0.6 percent. Upper 95% 1.68 -0.07 0.41arrow_forwardPlease provide me with the correct answer, along with the calculations, and do not use any AI toolsarrow_forward
- QUESTION 10 Answer questions 10 to 16 based on the regression outputs given in Table 1& 2. Table 1 DATA4-1: Data on single family homes in University City community of San Diego, in 1990. price - sale price in thousands of dollars (Range 199. 9 505) sqft - square feet of living area (Range 1065 - 3000) Table 2 Model 1: OLS, using observations 1-14 Dependent variable: price coefficient std. error t-ratio p-value 52. 3509 0.138750 37. 2855 0.0187329 0. 1857 8. 20e-06 *** const sqft 7. 407 Me dependent var Sun squared resid R-squared F(1, 12) Log-likelihood Schwarz criterion 317. 4929 18273. 57 0. 820522 54. 86051 -70. 08421 145. 4465 Hannan-Quinn S.D. dependent var S.E. of regression Adjusted R-squared P-value (F) Akaike criterion 88. 49816 39. 02304 0. 805565 8. 20e-06 144. 1684 144. 0501 There are observations included in this dataset. It is a. data. O 12; cross-sectional 13; time-series data 14; cross-sectional In this regression model, sale price of a single-family house is the. the…arrow_forward6) Suppose you have the following data on the price of orange and the quantity sold: Price per Pound (in Quantity Sold (in Dollars) Pounds) 0.50 0.75 1.00 1.25 1.50 10 7 699 5 2 Assume that the quantity sold (Y) is a linear function of the price (X), i.e. Y₁ =B₁ + B₂X₁ + ε₁ Estimate the population regression coefficients. (Do not use Computer)arrow_forwardq11-arrow_forward
- The data for this question is given in the file 1.Q1.xlsx(see image) and it refers to data for some cities X1 = total overall reported crime rate per 1 million residents X3 = annual police funding in $/resident X7 = % of people 25 years+ with at least 4 years of college (a) Estimate a regression with X1 as the dependent variable and X3 and X7 as the independent variables. (b) Will additional education help to reduce total overall crime (lead to a statistically significant reduction in crime)? Please explain. (c) Will an increase in funding for the police departments help reduce total overall crime (lead to a statistically significant reduction in total overall crime)? Please explain. (d) If you were asked to recommend a policy to reduce crime, then, based only on the above regression results, would you choose to invest in education (local schools) or in additional funding for the police? Please explain.arrow_forwardUsing Excel, Big Poppa's estimates the weekly demand function for its BBQ sandwiches to be QD = 1,385.63 - 22.30P. In reference to the estimated slope coefficient for price, which of the following standard errors gives you the most confidence (i.e., largest t-statistics) that the estimated slope coefficient is close to the true slope coefficient? 37) _____ A) -22.0 B) 2.15 C) 1.12 D) 22.0 Could you put some explanations please.arrow_forwardImagine you are trying to explain the effect of square footage on home sale prices in the United States. You collect a random sample of 100,000 homes that recently sold. a) Homes can be one of three types: single-family houses, townhomes, or condos. How would you control for a home’s type in a regression model? b) Write down a regression model that includes controls for home type, square footage, and number of bedrooms. c) How would you interpret the estimated coefficients for each of the variables from part b? Be specific. Note Don't forget to include dummy variables.arrow_forward
- For each of the following scenarios, indicate whether the relationship between the two variables is positive or negative, as well as which line on the previous graph has a slope that reflects this type of relationship. Hint: The X-axis and Y-axis on the graph are not labeled intentionally. You need to substitute the variables from each scenario for the horizontal and vertical axis. For example, in the first scenario, X-axis should be labeled “ ice-cream" and Y-axis should be labeled "The temperature". Relationship options: positive, negative Line options: A, B, C, D True or False: Line D has a slope of infinity.arrow_forwardGeneral Cereals is using a regression model to estimate the demand for Tweetie Sweeties, a whistle-shaped, sugar-coated breakfast cereal for children. The following (multiplicative exponential) demand function is being used: QD= 6,280 P 1.35) 42.05 N 2.70 where QD quantity demanded, in 10-oz boxes P = price per box, in dollars A = advertising expenditures on daytime television, in dollars N = proportion of the population under 12 years old, in percent What is the point price elasticity of demand for Tweetie Sweeties? O 2.70 O 2.05 -0.66 -1.35 What is the advertising elasticity of demand? -1.35 O 2.70 O 0.76 O 2.05 According to the estimated model, a percent increase in the proportion of the population under 12 years old by percent. the quantity demandedarrow_forwardTable 4.1 SUMMARY OUTPUT Regression Statistics Multiple R R Square Adjusted R Square 0.99794806 Missing 0.99513164 Standard Error 1.64839211 Observations 20 ANOVA Significance F af Missing 16 19 MS F Regression 10561.07486 Missing 1295.585 2.66E-19 Residual 43.47514498 2.717197 Total 10604.55 Coefficients 0.562 Standard Error t Stat P-Value Intercept X1 1.327 0.424 0.677 0.959 0.038 25.245 0.000 X2 1.117 0.125 8.916 0.000 X3 1.460 0.066 22.185 0.000 Consider the output shown in Table 4.1. Which of the predictors has the greatest impact on the dependent variable? X2 Intercept X1 X3arrow_forward
arrow_back_ios
SEE MORE QUESTIONS
arrow_forward_ios
Recommended textbooks for you
 Principles of Economics (12th Edition)EconomicsISBN:9780134078779Author:Karl E. Case, Ray C. Fair, Sharon E. OsterPublisher:PEARSON
 Engineering Economy (17th Edition)EconomicsISBN:9780134870069Author:William G. Sullivan, Elin M. Wicks, C. Patrick KoellingPublisher:PEARSON
 Principles of Economics (MindTap Course List)EconomicsISBN:9781305585126Author:N. Gregory MankiwPublisher:Cengage Learning
 Managerial Economics: A Problem Solving ApproachEconomicsISBN:9781337106665Author:Luke M. Froeb, Brian T. McCann, Michael R. Ward, Mike ShorPublisher:Cengage Learning
 Managerial Economics & Business Strategy (Mcgraw-...EconomicsISBN:9781259290619Author:Michael Baye, Jeff PrincePublisher:McGraw-Hill Education
Principles of Economics (12th Edition)
Economics
ISBN:9780134078779
Author:Karl E. Case, Ray C. Fair, Sharon E. Oster
Publisher:PEARSON
Engineering Economy (17th Edition)
Economics
ISBN:9780134870069
Author:William G. Sullivan, Elin M. Wicks, C. Patrick Koelling
Publisher:PEARSON
Principles of Economics (MindTap Course List)
Economics
ISBN:9781305585126
Author:N. Gregory Mankiw
Publisher:Cengage Learning
Managerial Economics: A Problem Solving Approach
Economics
ISBN:9781337106665
Author:Luke M. Froeb, Brian T. McCann, Michael R. Ward, Mike Shor
Publisher:Cengage Learning
Managerial Economics & Business Strategy (Mcgraw-...
Economics
ISBN:9781259290619
Author:Michael Baye, Jeff Prince
Publisher:McGraw-Hill Education