
A First Course in Probability (10th Edition)
10th Edition
ISBN: 9780134753119
Author: Sheldon Ross
Publisher: PEARSON
expand_more
expand_more
format_list_bulleted
Related questions
Question
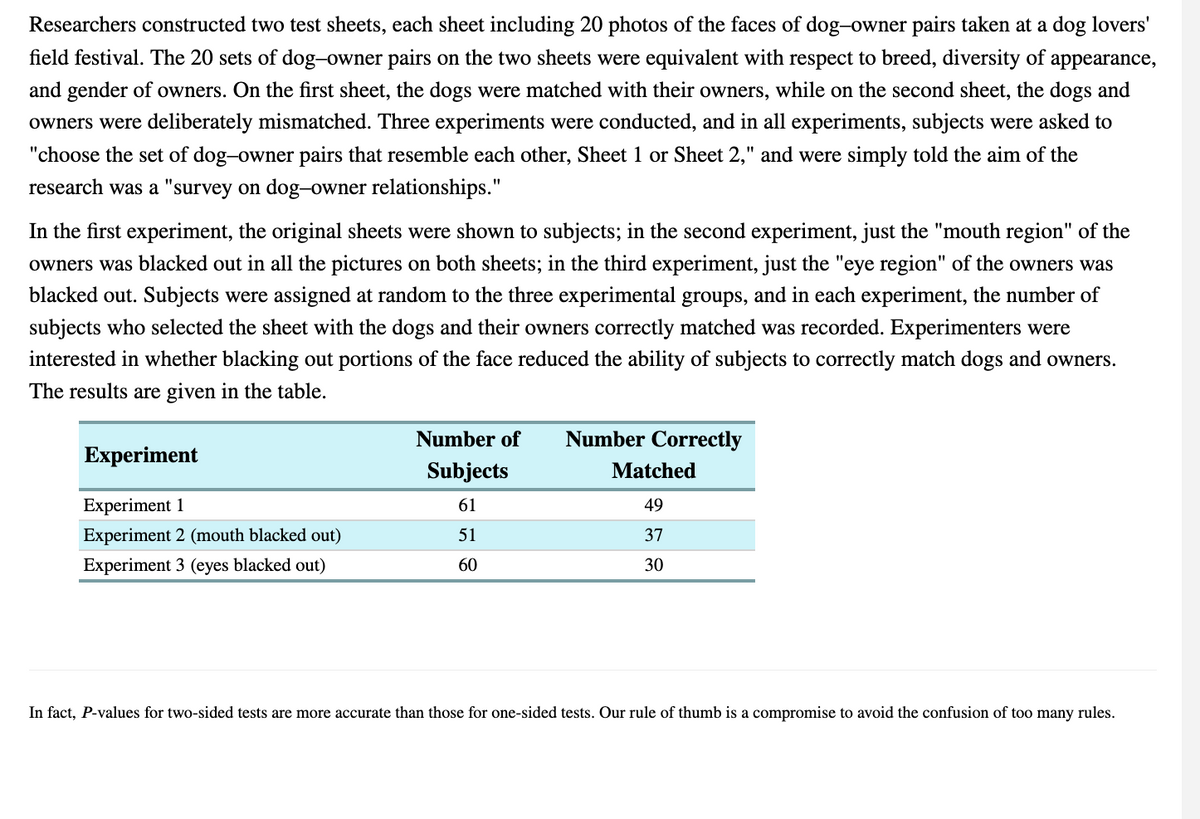

Transcribed Image Text:Researchers constructed two test sheets, each sheet including 20 photos of the faces of dog-owner pairs taken at a dog lovers'
field festival. The 20 sets of dog-owner pairs on the two sheets were equivalent with respect to breed, diversity of appearance,
and gender of owners. On the first sheet, the dogs were matched with their owners, while on the second sheet, the dogs and
owners were deliberately mismatched. Three experiments were conducted, and in all experiments, subjects were asked to
"choose the set of dog-owner pairs that resemble each other, Sheet 1 or Sheet 2," and were simply told the aim of the
research was a "survey on dog-owner relationships."
In the first experiment, the original sheets were shown to subjects; in the second experiment, just the "mouth region" of the
owners was blacked out in all the pictures on both sheets; in the third experiment, just the "eye region" of the owners was
blacked out. Subjects were assigned at random to the three experimental groups, and in each experiment, the number of
subjects who selected the sheet with the dogs and their owners correctly matched was recorded. Experimenters were
interested in whether blacking out portions of the face reduced the ability of subjects to correctly match dogs and owners.
The results are given in the table.
Experiment
Experiment 1
Experiment 2 (mouth blacked out)
Experiment 3 (eyes blacked out)
Number of Number Correctly
Subjects
61
51
60
Matched
49
37
30
In fact, P-values for two-sided tests are more accurate than those for one-sided tests. Our rule of thumb is a compromise to avoid the confusion of too many rules.

Transcribed Image Text:O Macmillan Learning
SOLVE: Assume the samples can be thought of as an SRS. A hypothesis test can be conducted given that there are more than
five successes (correctly identified the pairs) and more than five failures in each sample. Calculate the sample proportion for
each group, p₁ and 22, and the pooled sample proportion p. Give your answers to four decimal places.
P₁
P₂
=
p=
0.8033
Z=
0.5
0.6529
Compute the test statistic z. Give your answer to four decimal places.
0.9710
Incorrect
Expert Solution
This question has been solved!
Explore an expertly crafted, step-by-step solution for a thorough understanding of key concepts.

Step by stepSolved in 2 steps with 2 images

Knowledge Booster

Similar questions
- Get me easy way to explainarrow_forwardUse the expression in the accompanying discussion of sample size to find the size of each sample if you want to estimate the difference between proportions of men and women who own smartphones assume that you want 99% confidence that your area is no more than 0.045arrow_forwardA sample of 900 computer chips revealed that 46 % of the chips do not fail in the first 1000 hours of their use. The company's promotional literature states that 50 % of the chips do not fail in the first 1000 hours of their use. The quality control manager wants to test the claim that the actual percentage that do not fail is different from the stated percentage. Find the value of the test statistic. Round your answer to two decimal places. Answer Tables Keypadarrow_forward
- The accompanying table contains data on the weight, in grams, of a sample of 50 tea bags produced during an eight-hour shift. Complete parts (a) through (d). Click the icon to view the data table. (Round to two decimal places as needed.) Find the p-value. p-value = .819 (F State the conclusi Do not reject H b. Construct a 90 The 90% confider (Round to four de Interpret the 90% More Info Tea Bag Weight (in grams) 5.65 5.45 5.42 5.41 5.53 5.34 5.54 5.46 5.53 5.59 5.42 5.51 5.55 5.54 5.61 5.56 5.47 5.44 5.49 5.39 5.46 5.63 5.53 5.32 5.68 5.29 5.49 5.76 5.56 5.41 5.57 5.59 5.52 5.33 5.49 5.54 5.61 5.44 5.45 5.24 5.56 5.63 5.49 5.58 5.68 5.43 5.49 5.57 5.58 5.35 I Xarrow_forwardHelp with to= what is p value =arrow_forwardArsenic is toxic to humans and people can be exposed to it through contaminated drinking water, food, dust, and soil. Scientists have devised a non-invasive way to measure a person's level of arsenic poisoning: by examining toenail clippings. In a recent study, scientists measure the level of arsenic (in mg/kg) in toenail clippings of 8 people who lived near a former arsenic mine in Great Britain. The following levels are recorded. 0.8, 1.9, 2.7, 3.4, 3.9, 7.1, 11.9, 26.0 Below are the summary statistics of the data. min Q1 median Q3 max sd n mean 0.8 2.5 3.65 8.3 26 7.2125 8.368041 8 Suppose the 8 people examined were randomly sampled from residents near the former arsenic mine. Is it legitimate to construct a 95% confidence interval for the mean level of arsenic (in mg/kg) in toenail clippings for residents near the former arsenic mine using a t-distribution? Explain briefly.arrow_forward
arrow_back_ios
arrow_forward_ios
Recommended textbooks for you
- A First Course in Probability (10th Edition)ProbabilityISBN:9780134753119Author:Sheldon RossPublisher:PEARSON

A First Course in Probability (10th Edition)
Probability
ISBN:9780134753119
Author:Sheldon Ross
Publisher:PEARSON