
MATLAB: An Introduction with Applications
6th Edition
ISBN: 9781119256830
Author: Amos Gilat
Publisher: John Wiley & Sons Inc
expand_more
expand_more
format_list_bulleted
Related questions
Question
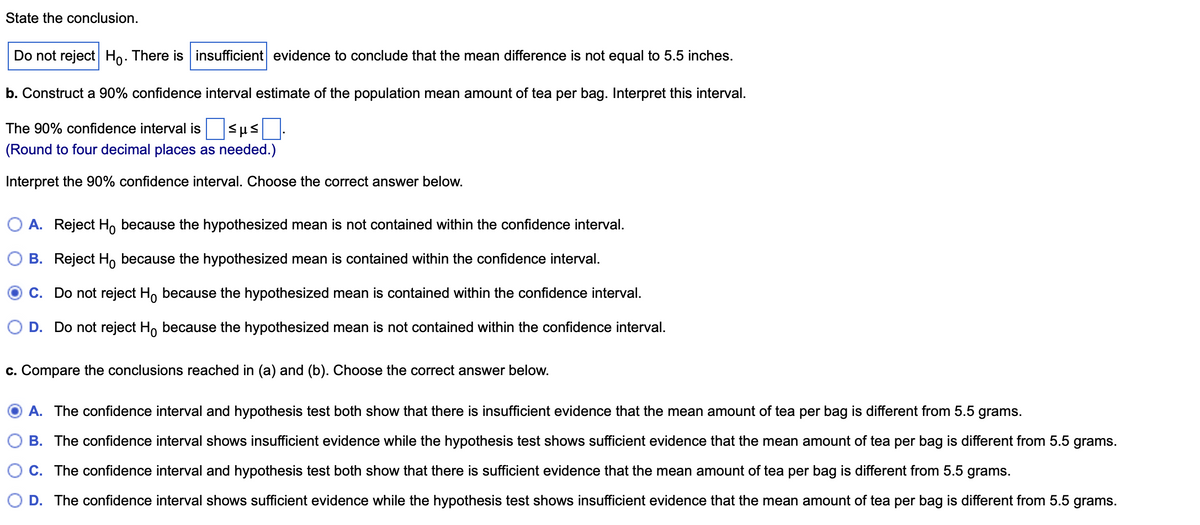

Transcribed Image Text:State the conclusion.
Do not reject Ho. There is insufficient evidence to conclude that the mean difference is not equal to 5.5 inches.
b. Construct a 90% confidence interval estimate of the population mean amount of tea per bag. Interpret this interval.
The 90% confidence interval is ≤μ≤
(Round to four decimal places as needed.)
Interpret the 90% confidence interval. Choose the correct answer below.
O A. Reject Ho because the hypothesized mean is not contained within the confidence interval.
B. Reject Ho because the hypothesized mean is contained within the confidence interval.
C. Do not reject Ho because the hypothesized mean is contained within the confidence interval.
D. Do not reject Ho because the hypothesized mean is not contained within the confidence interval.
c. Compare the conclusions reached in (a) and (b). Choose the correct answer below.
A. The confidence interval and hypothesis test both show that there is insufficient evidence that the mean amount of tea per bag is different from 5.5 grams.
B. The confidence interval shows insufficient evidence while the hypothesis test shows sufficient evidence that the mean amount of tea per bag is different from 5.5 grams.
C. The confidence interval and hypothesis test both show that there is sufficient evidence that the mean amount of tea per bag is different from 5.5 grams.
D. The confidence interval shows sufficient evidence while the hypothesis test shows insufficient evidence that the mean amount of tea per bag is different from 5.5 grams.

Transcribed Image Text:The accompanying table contains data on the weight, in grams, of a sample of 50 tea bags produced during an eight-hour shift. Complete parts (a) through (d).
Click the icon to view the data table.
(Round to two decimal places as needed.)
Find the p-value.
p-value = .819 (F
State the conclusi
Do not reject H
b. Construct a 90
The 90% confider
(Round to four de
Interpret the 90%
More Info
Tea Bag Weight (in grams)
5.65 5.45 5.42 5.41 5.53 5.34 5.54 5.46 5.53
5.59 5.42 5.51 5.55 5.54 5.61 5.56 5.47 5.44
5.49 5.39 5.46 5.63 5.53
5.32
5.68 5.29 5.49
5.76 5.56 5.41 5.57 5.59 5.52 5.33 5.49 5.54
5.61 5.44 5.45 5.24 5.56 5.63 5.49
5.58 5.68
5.43
5.49
5.57
5.58
5.35
I
X
Expert Solution
This question has been solved!
Explore an expertly crafted, step-by-step solution for a thorough understanding of key concepts.
Step 1: State the hypotheses and determine the conclusion.
VIEW Step 2: Obtain the 90% confidence interval estimate of the population mean amount of tea per bag.
VIEW Step 3: calculate the confidence interval.
VIEW Step 4: Compare the conclusions obtained from part(a) and part(b).
VIEW Solution
VIEW 
Step by stepSolved in 5 steps with 6 images

Knowledge Booster

Similar questions
- In a survey of 2000 adults in a recent year, 713 made a New Year's resolution to eat healthier. Construct 90% and 95% confidence intervals for the population proportion. Interpret the results and compare the widths of the confidence intervals. The 90% confidence interval for the population proportion p is (.D. (Round to three decimal places as needed.)arrow_forwardIf n = 530 and X = 424, construct a 99% confidence interval for the population proportion, p.Give your answers to three decimals < p <arrow_forwardIn a survey of 2092 adults in a recent year, 748 made a New Year's resolution to eat healthier. Construct 90% and 95% confidence intervals for the population proportion. Interpret the results and compare the widths of the confidence intervals. The 90% confidence interval for the population proportion p is ( , ). Round to three decimal places as needed.arrow_forward
- If n=21, (x-bar)=37, and s=3, construct a confidence interval at a 90% confidence level. Assume the data came from a normally distributed population. Give your answers to one decimal place.arrow_forwardIf n = 11,(x -bar)= 31, and s = 19, construct a confidence interval at a 99% confidence level. Assume the data came from a normally distributed population. Give your answers to three decimal places.arrow_forwardIf n=400 and X=120, construct a 90% confidence interval estimate for the population proportion. (Round to four decimal places as needed.)arrow_forward
- Tina catches a 14-pound bass. She does not know the population mean or standard deviation. So she takes a sample of five friends and they say the last bass they caught was 9, 12, 13, 10, and 10 pounds. Find the t and calculate a 95% (α = .05) confidence interval.arrow_forwardIf n=17, (x-bar)=48, and s=2, construct a confidence interval at a 80% confidence level. Assume the data came from a normally distributed population. Give your answers to one decimal place.arrow_forwardUse the given confidence interval to find the margin of error and the sample proportion. (0.740,0.766) E=enter your response here (Type an integer or a decimal.)arrow_forward
- A sample of n = 200 college students are asked if they believe in extraterrestrial life and 120 of these students say that they do. The data are used to test if more than half of college students believe in extraterrestrial life. d. Find a 95% confidence interval e. Write a conclusion for the confidence intervalarrow_forwardA random sample of high school students is used to estimate the mean time all high school students study for Algebra II tests. A 99% confidence interval based on this sample is: 1.7 hours to 3.1 hours. What is the sample mean?arrow_forwardUse the given data to construct a confidence interval for the population proportion p of the requested level. x = 52, n = 71, confidence level 95% Round the answer to at least three decimal places. D. The confidence interval isarrow_forward
arrow_back_ios
SEE MORE QUESTIONS
arrow_forward_ios
Recommended textbooks for you
- MATLAB: An Introduction with ApplicationsStatisticsISBN:9781119256830Author:Amos GilatPublisher:John Wiley & Sons Inc
 Probability and Statistics for Engineering and th...StatisticsISBN:9781305251809Author:Jay L. DevorePublisher:Cengage Learning
 Statistics for The Behavioral Sciences (MindTap C...StatisticsISBN:9781305504912Author:Frederick J Gravetter, Larry B. WallnauPublisher:Cengage Learning
  Elementary Statistics: Picturing the World (7th E...StatisticsISBN:9780134683416Author:Ron Larson, Betsy FarberPublisher:PEARSON
 The Basic Practice of StatisticsStatisticsISBN:9781319042578Author:David S. Moore, William I. Notz, Michael A. FlignerPublisher:W. H. Freeman
 Introduction to the Practice of StatisticsStatisticsISBN:9781319013387Author:David S. Moore, George P. McCabe, Bruce A. CraigPublisher:W. H. Freeman
MATLAB: An Introduction with Applications
Statistics
ISBN:9781119256830
Author:Amos Gilat
Publisher:John Wiley & Sons Inc
Probability and Statistics for Engineering and th...
Statistics
ISBN:9781305251809
Author:Jay L. Devore
Publisher:Cengage Learning
Statistics for The Behavioral Sciences (MindTap C...
Statistics
ISBN:9781305504912
Author:Frederick J Gravetter, Larry B. Wallnau
Publisher:Cengage Learning
Elementary Statistics: Picturing the World (7th E...
Statistics
ISBN:9780134683416
Author:Ron Larson, Betsy Farber
Publisher:PEARSON
The Basic Practice of Statistics
Statistics
ISBN:9781319042578
Author:David S. Moore, William I. Notz, Michael A. Fligner
Publisher:W. H. Freeman
Introduction to the Practice of Statistics
Statistics
ISBN:9781319013387
Author:David S. Moore, George P. McCabe, Bruce A. Craig
Publisher:W. H. Freeman