MATLAB: An Introduction with Applications
6th Edition
ISBN: 9781119256830
Author: Amos Gilat
Publisher: John Wiley & Sons Inc
expand_more
expand_more
format_list_bulleted
Question

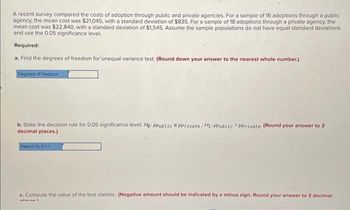
Transcribed Image Text:A recent survey compared the costs of adoption through public and private agencies. For a sample of 16 adoptions through a public
agency, the mean cost was $21,045, with a standard deviation of $835. For a sample of 18 adoptions through a private agency, the
mean cost was $22,840, with a standard deviation of $1,545. Assume the sample populations do not have equal standard deviations
and use the 0.05 significance level.
Required:
a. Find the degrees of freedom for unequal variance test. (Round down your answer to the nearest whole number.)
Degrees of freedom
b. State the decision rule for 0.05 significance level: He: HPublic SHPrivate H₁: HPublic HPrivate (Round your answer to 3
decimal places.)
Reject Ho if t
c. Compute the value of the test statistic. (Negative amount should be indicated by a minus sign. Round your answer to 3 decimal
miscar

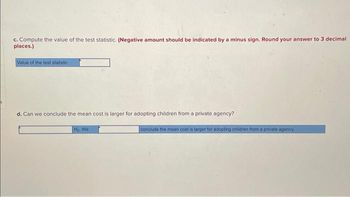
Transcribed Image Text:c. Compute the value of the test statistic. (Negative amount should be indicated by a minus sign. Round your answer to 3 decimal
places.)
Value of the test statistic
d. Can we conclude the mean cost is larger for adopting children from a private agency?
Ho We
conclude the mean cost is larger for adopting children from a private agency.
Expert Solution
This question has been solved!
Explore an expertly crafted, step-by-step solution for a thorough understanding of key concepts.
This is a popular solution
Trending nowThis is a popular solution!
Step by stepSolved in 4 steps with 14 images

Knowledge Booster
Similar questions
- A parent claims that children spend about 2 hours a day in front of computer screens. We think that the parent is underestimating the situation and does a survey of 25 children and finds a mean of 3.5 and sample standard deviation of 1.2 hours. Check the parents claim at the .05 level.arrow_forwardThe average McDonald's restaurant generates $2.2 million in sales each year with a standard deviation of 0.9. Malik wants to know if the average sales generated by McDonald's restaurants in New Jersey is different than the worldwide average. He surveys 32 restaurants in New Jersey and finds the following data (in millions of dollars): 1, 1.2, 2.1, 2.8, 2.7, 1.5, 1.7, 3.5, 1.4, 3.6, 2.3, 2.8, 1.8, 2.1, 1.4, 2.1, 2.8, 2.1, 2.1, 2, 4.1, 3.1, 2.2, 3.7, 2.1, 2.4, 2.8, 1.1, 1.7, 2.2, 1.6, 3.4 Perform a hypothesis test using a 8% level of significance. Step 1: State the null and alternative hypotheses. Ho:?v|?く H。:?v||?く (So we will be performing a Select an answer v test.) Step 2: Assuming the null hypothesis is true, determine the features of the distribution of point estimates using the Central Limit Theorem. By the Central Limit Theorem, we know that the point estimates are Select an answer with distribution mean and distribution standard deviation Step 3: Find the p-value of the point…arrow_forwardSuppose the annual employer 401K cost per participant is normally distributed with a mean of $770. If 73.89% of such costs are greater than $370, what is the standard deviation of the annual employer 401K cost per participant?arrow_forward
- Taking the family to an amusement park has become increasingly costly according to the industry publication Amusement Business, which provides figures on the cost for a family of four to spend the day at one of America's amusement parks. A random sample of 25 families of four that attended amusement parks yielded a sample mean of $232 and sample standard deviation of $42. A. What is the best point estimate for the average (mean) cost for a family of four to spend the day at an American amusement park? Round your answer to the nearest dollar. Point estimate: $ B. Obtain a 95% confidence interval for the mean cost for a family of four to spend the day at an American amusement park? Round your lower and upper limits to the nearest dollar. Confidence interval: $ to $ C. What is the margin of error for the 95% confidence interval found in part B? Round answer to the nearestarrow_forwardA quick survey of peanut butter prices had standard deviation and mean of $0.26 and $3.68, respectively. Compute the area for a peanut butter jar costing between $3.50 and $4.25.arrow_forwardA study of compulsive buying behavior conducted a national telephone survey in 2004 of adults aged 18 and over. The total credit card balance had a mean of $3,399 and standard deviation of $5,595 for 100 compulsive buyers and a mean of $2,837 and standard deviation of $6,335 for 1,682 other respondents. Estimate the difference between the sample means for compulsive buyers and other respondents, and find the standard error of the difference. Let mu1 = the population mean total credit card balance for non-compulsive buyers Let mu2 = the population mean total credit card balance for compulsive buyers y(bar)2-y(bar)1= Standard error of the difference =arrow_forward
- If the weekly grocery expenditure of households in a certain urban market is known to be normally distributed with a mean of $150 and a standard deviation of $30, what proportion of the households spend between $110 and $160 per week on groceries?arrow_forwardSuppose the average annual in-state tuition and required fees for public 4-year institutions follow a normal distribution with a population mean of $9,329 and a population standard deviation of $1865. What is the interquartile range of public 4- year institution cost? What cost would place a public 4-year institution into the lowest 10%?arrow_forwardAccording to the document Consumer Expenditures, the average consumer spent $1,874 on apparel and services in 2006. That same year, a sample of 25 consumers in the Northeast had a sample mean and standard deviation of $2,061 and $351, respectively. We are to conduct a hypotheses test to determine whether the 2006 mean annual expenditure on apparel and services for consumers in the Northeast differed from the national mean of $1,874. a. Test statistic isb. The ? − value of the test isc. At the significance level calculated in part b), we conclude that the mean annual expenditure on apparel and services for consumers in the Northeast isarrow_forward
- In an all boys school, the heights of the student body are normally distributed with a mean of 71 inches and a standard deviation of 4.5 inches. Out of the 1912 boys who go to that school, how many would be expected to be between 61 and 70 inches tall, to the nearest whole number?arrow_forwardThe mean hourly wage for employees in goods-producing industries is currently $24.57 (Bureau of Labor Statistics website, April, 12, 2012). Suppose we take a sample of employees from the manufacturing industry to see if the mean hourly wage differs from the reported mean of $24.57 for the goods-producing industries. b. Suppose a sample of 30 employees from the manufacturing industry showed a sample mean of $23.89 per hour. Assume a population standard deviation of $2.40 per hour and compute the p-value. Round your answer to four decimal places. c. With alpha =0.05 as the level of significance, what is your conclusion? The input in the box below will not be graded, but may be reviewed and considered by your instructor.arrow_forwardA polling organization reported data from a survey of 2000 randomly selected Canadians who carry debit cards. Participants in this survey were asked what they considered the minimum purchase amount for which it would be acceptable to use a debit card. Suppose that the sample mean and standard deviation were $9.14 and $7.70, respectively. (These values are consistent with a histogram of the sample data that appears in the report.)Do these data provide convincing evidence that the mean minimum purchase amount for which Canadians consider the use of a debit card to be appropriate is less than $10? Carry out a hypothesis test with a significance level of 0.01. (Use a statistical computer package to calculate the P-value. Round your test statistic to two decimal places and your P-value to four decimal places.) t = P-value = State your conclusion. Reject H0. We do not have convincing evidence that the mean minimum purchase amount for which Canadians consider it…arrow_forward
arrow_back_ios
SEE MORE QUESTIONS
arrow_forward_ios
Recommended textbooks for you
 MATLAB: An Introduction with ApplicationsStatisticsISBN:9781119256830Author:Amos GilatPublisher:John Wiley & Sons Inc
 Probability and Statistics for Engineering and th...StatisticsISBN:9781305251809Author:Jay L. DevorePublisher:Cengage Learning
 Statistics for The Behavioral Sciences (MindTap C...StatisticsISBN:9781305504912Author:Frederick J Gravetter, Larry B. WallnauPublisher:Cengage Learning
 Elementary Statistics: Picturing the World (7th E...StatisticsISBN:9780134683416Author:Ron Larson, Betsy FarberPublisher:PEARSON
 The Basic Practice of StatisticsStatisticsISBN:9781319042578Author:David S. Moore, William I. Notz, Michael A. FlignerPublisher:W. H. Freeman
 Introduction to the Practice of StatisticsStatisticsISBN:9781319013387Author:David S. Moore, George P. McCabe, Bruce A. CraigPublisher:W. H. Freeman

MATLAB: An Introduction with Applications
Statistics
ISBN:9781119256830
Author:Amos Gilat
Publisher:John Wiley & Sons Inc

Probability and Statistics for Engineering and th...
Statistics
ISBN:9781305251809
Author:Jay L. Devore
Publisher:Cengage Learning

Statistics for The Behavioral Sciences (MindTap C...
Statistics
ISBN:9781305504912
Author:Frederick J Gravetter, Larry B. Wallnau
Publisher:Cengage Learning

Elementary Statistics: Picturing the World (7th E...
Statistics
ISBN:9780134683416
Author:Ron Larson, Betsy Farber
Publisher:PEARSON

The Basic Practice of Statistics
Statistics
ISBN:9781319042578
Author:David S. Moore, William I. Notz, Michael A. Fligner
Publisher:W. H. Freeman

Introduction to the Practice of Statistics
Statistics
ISBN:9781319013387
Author:David S. Moore, George P. McCabe, Bruce A. Craig
Publisher:W. H. Freeman