
ENGR.ECONOMIC ANALYSIS
14th Edition
ISBN: 9780190931919
Author: NEWNAN
Publisher: Oxford University Press
expand_more
expand_more
format_list_bulleted
Related questions
Question
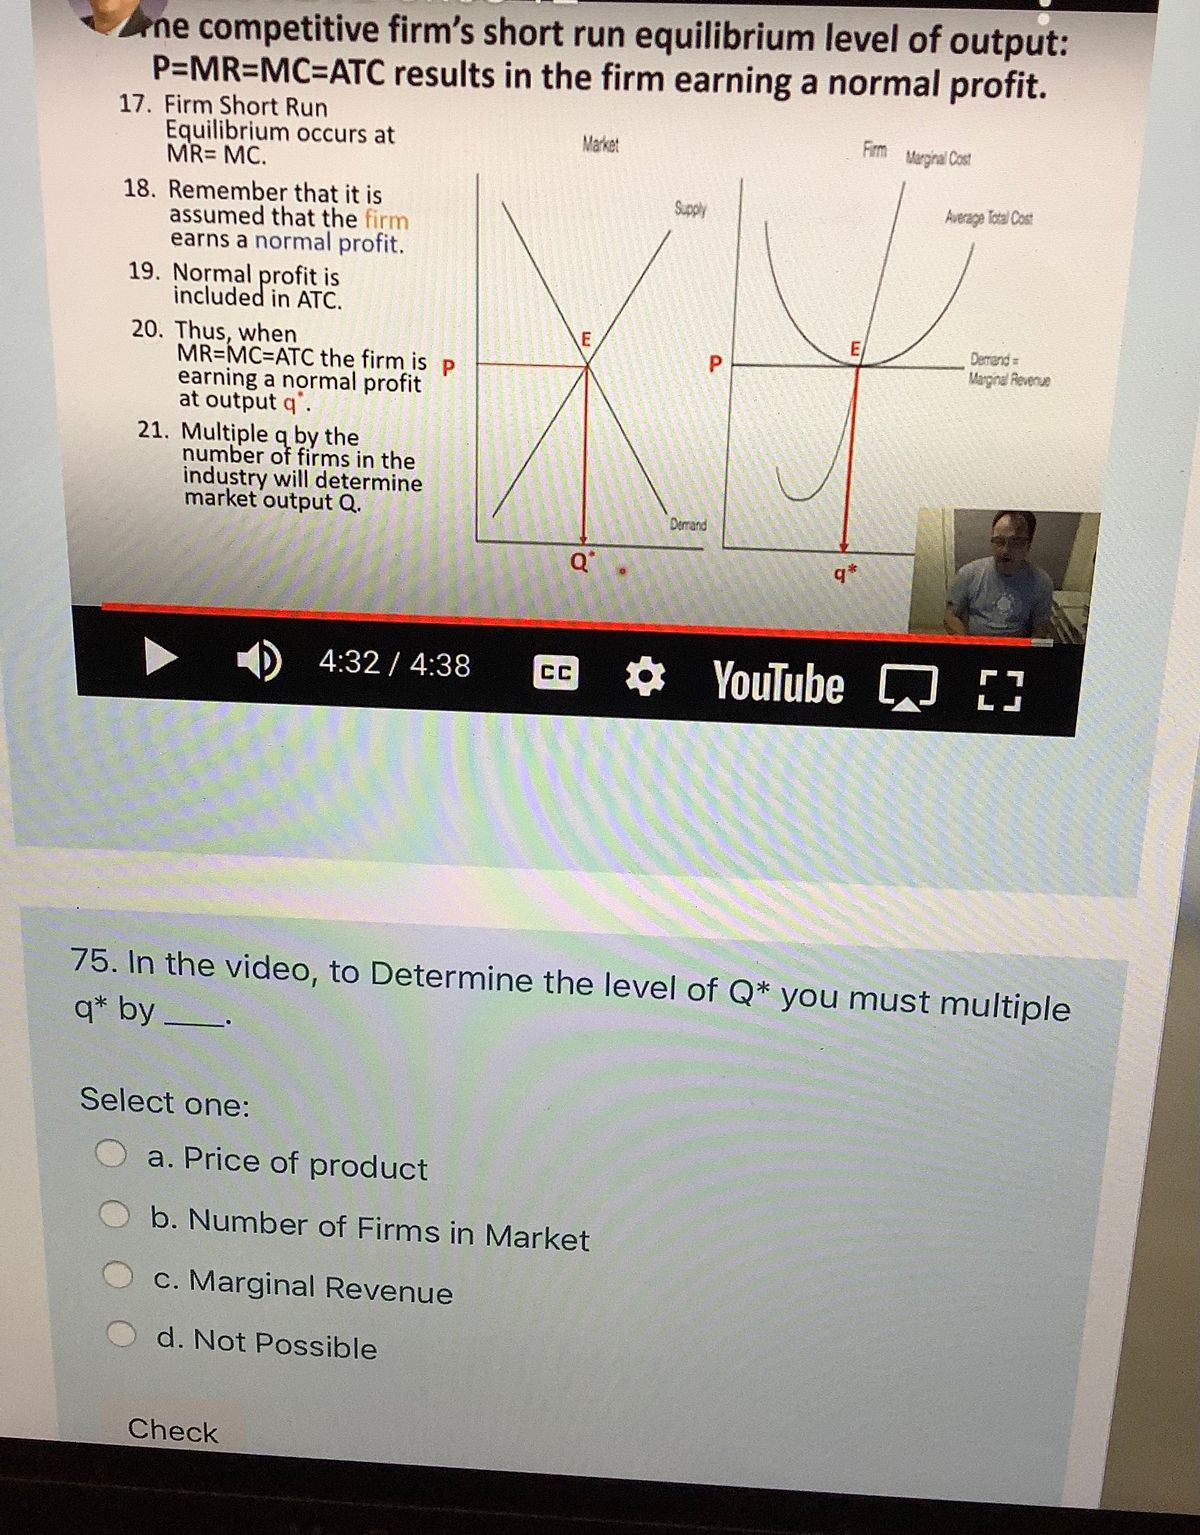

Transcribed Image Text:ne competitive firm's short run equilibrium level of output:
P=MR=MC%3DATC results in the firm earning a normal profit.
17. Firm Short Run
Equilibrium occurs at
MR= MC.
Market
Firm
Marginal Cost
18. Remember that it is
assumed that the firm
earns a normal profit.
19. Normal profit is
included in ATC.
Supply
Average Total Cost
20. Thus, when
MR=MC=ATC the firm is p
earning a normal profit
at output q'.
21. Multiple q by the
number of firms in the
industry will determine
market output Q.
Derrend
Marginal Reverue
P
Demand
q*
4:32 / 4:38
* YouTube D
CC
75. In the video, to Determine the level of Q* you must multiple
q* by_
Select one:
a. Price of product
b. Number of Firms in Market
c. Marginal Revenue
d. Not Possible
Check
Expert Solution
This question has been solved!
Explore an expertly crafted, step-by-step solution for a thorough understanding of key concepts.

Step by stepSolved in 2 steps

Knowledge Booster


Learn more about
Need a deep-dive on the concept behind this application? Look no further. Learn more about this topic, economics and related others by exploring similar questions and additional content below.Similar questions
- The canola farming industry is perfectly competitive. Assume that it is in long-run equilibrium at quantity Q0 and price P0. Assume also that it is a constant-cost industry. a) Draw a supply and demand diagram for the canola market showing this equilibrium b.) draw diagram for a typical canola growing farm in its initial long run equilibrium, showing its Marginal Cost, Average Total Cost, and Long Run Average Cost curves. Are there any profits being made by this firm?arrow_forwardConsider the perfectly competitive spice market. At the equilibrium price, the elasticity of market supply is 2.65 and the elasticity of demand is 0.40. Spice is a normal good. An increase in incomes cause the market PRICE of spices to rise by 3%. What is the percentage change in market QUANTITY? Notes: Enter a number only, do not include the % sign. If it decreases, include a negative sign before your number. For example, if it is a 15.675% decrease, enter -15.68 not -0.15. If quantity decreases include a negative sign.arrow_forwardDraw the short-run situation in a P.C. market satisfying: Market demand and supply determines that market price is $7 An individual firm's profit maximization output level is 30 units This individual firm is earning a positive economic profit and shade the area of profitarrow_forward
- PRICE (Cents per bushel) COST (Cents per bushel) 100 90 80 70 60 50 ATC 40 30 20 10 AVC MC 0 5 10 15 20 25 30 35 40 45 50 OUTPUT (Thousands of bushels) The following graph shows the market demand for wheat. 1. Use the orange points (square symbol) to plot the short-run industry supply curve for the wheat industry. Specifically, place an orange point at the lowest point of the supply curve and another orange point at the highest point of the supply curve. (Hint: You can disregard the portion of the supply curve that corresponds to prices where there is no output, since this is the industry supply curve. Plot your points in the order in which you would like them connected. Line segments will connect the points automatically.) 2. Place the black point (plus symbol) on the graph to indicate the short-run equilibrium price and quantity in this market. (Note: Dashed drop lines will automatically extend to both axes.) 100 90 80 60 30 20 2 2 2 2 8 8 2 2 2 2 ° 0 Demand 350 700 1050 1400 1750…arrow_forwardIn a perfectly competitive market: the market price is 28 Marginal cost (MC) = 2(Q) + 8 average total cost at equilibrium is 28, and average variable cost at equilibrium is 7 The profit maximizing price is Number The profit maximizing quantity is Number :Total revenue is Number Total cost is Number Average fixed cost is Number Total fixed cost is Number Total profit/loss is Number Marginal ravenue is Number At this market price,over time, firms would: 1. Enter the industry 2. leave the industry 3. There is no incentive to enter or leave the industry. Number (assume all firms have the same cost structure) :At the market price, could this be a long run equilibrium price? (if yes=1, no=D2) (assume all firms have the same cost structure) Numberarrow_forwardSuppose there are 5 firms in this industry, each of which has the cost curves previously shown.arrow_forward
arrow_back_ios
arrow_forward_ios
Recommended textbooks for you
 Principles of Economics (12th Edition)EconomicsISBN:9780134078779Author:Karl E. Case, Ray C. Fair, Sharon E. OsterPublisher:PEARSON
 Engineering Economy (17th Edition)EconomicsISBN:9780134870069Author:William G. Sullivan, Elin M. Wicks, C. Patrick KoellingPublisher:PEARSON
 Principles of Economics (MindTap Course List)EconomicsISBN:9781305585126Author:N. Gregory MankiwPublisher:Cengage Learning
 Managerial Economics: A Problem Solving ApproachEconomicsISBN:9781337106665Author:Luke M. Froeb, Brian T. McCann, Michael R. Ward, Mike ShorPublisher:Cengage Learning
 Managerial Economics & Business Strategy (Mcgraw-...EconomicsISBN:9781259290619Author:Michael Baye, Jeff PrincePublisher:McGraw-Hill Education
Principles of Economics (12th Edition)
Economics
ISBN:9780134078779
Author:Karl E. Case, Ray C. Fair, Sharon E. Oster
Publisher:PEARSON
Engineering Economy (17th Edition)
Economics
ISBN:9780134870069
Author:William G. Sullivan, Elin M. Wicks, C. Patrick Koelling
Publisher:PEARSON
Principles of Economics (MindTap Course List)
Economics
ISBN:9781305585126
Author:N. Gregory Mankiw
Publisher:Cengage Learning
Managerial Economics: A Problem Solving Approach
Economics
ISBN:9781337106665
Author:Luke M. Froeb, Brian T. McCann, Michael R. Ward, Mike Shor
Publisher:Cengage Learning
Managerial Economics & Business Strategy (Mcgraw-...
Economics
ISBN:9781259290619
Author:Michael Baye, Jeff Prince
Publisher:McGraw-Hill Education