
MATLAB: An Introduction with Applications
6th Edition
ISBN: 9781119256830
Author: Amos Gilat
Publisher: John Wiley & Sons Inc
expand_more
expand_more
format_list_bulleted
Related questions
Concept explainers
Question

Transcribed Image Text:* Question Completion Status:
Dep.-ATuar Sales
nuep.-palespersons
SUMMARY OUTPUT
Regression Statistics
Multiple R
R Square
Adjusted R Square
Standard Error
Observations
26.0000
ANOVA
Significance
df
SS
MS
E
Regression
Residual
Total
226.0190||
Standard
t Stat
P-value
Lower 95%
Upper 95%
Coefficients 6K Error
12.0763
8.0765
108.1810
8.9581
Intercept
Salespersons
26.0476
3.2251
SE
CI
CI
PI
PI
Upper
95%
Predicted
Predicted
Lower
Upper
Lower
Value
Value
95%
95%
95%
1.0000
2.0000
134.2286
160.2762
4.6800
5.3315
Save Al
Click Save and Submit to save and submit. Click Save All Answers to save all answers.
MacBook Pro

Transcribed Image Text:Standard
Coefficients
108.1810
26.0476
P-value
t Stat
8.9581
3.2251
Upper 95%
Error
12.0763
8.0765
Lower 95%
Intercept
Salespersons
SE
CI
CI
PI
PI
Predicted
Upper
Lower
Upper
95%
Predicted
Lower
Value
4.6800
5.3315
Value
95%
95%
95%
134.2286
160.2762
1.0000
2.0000
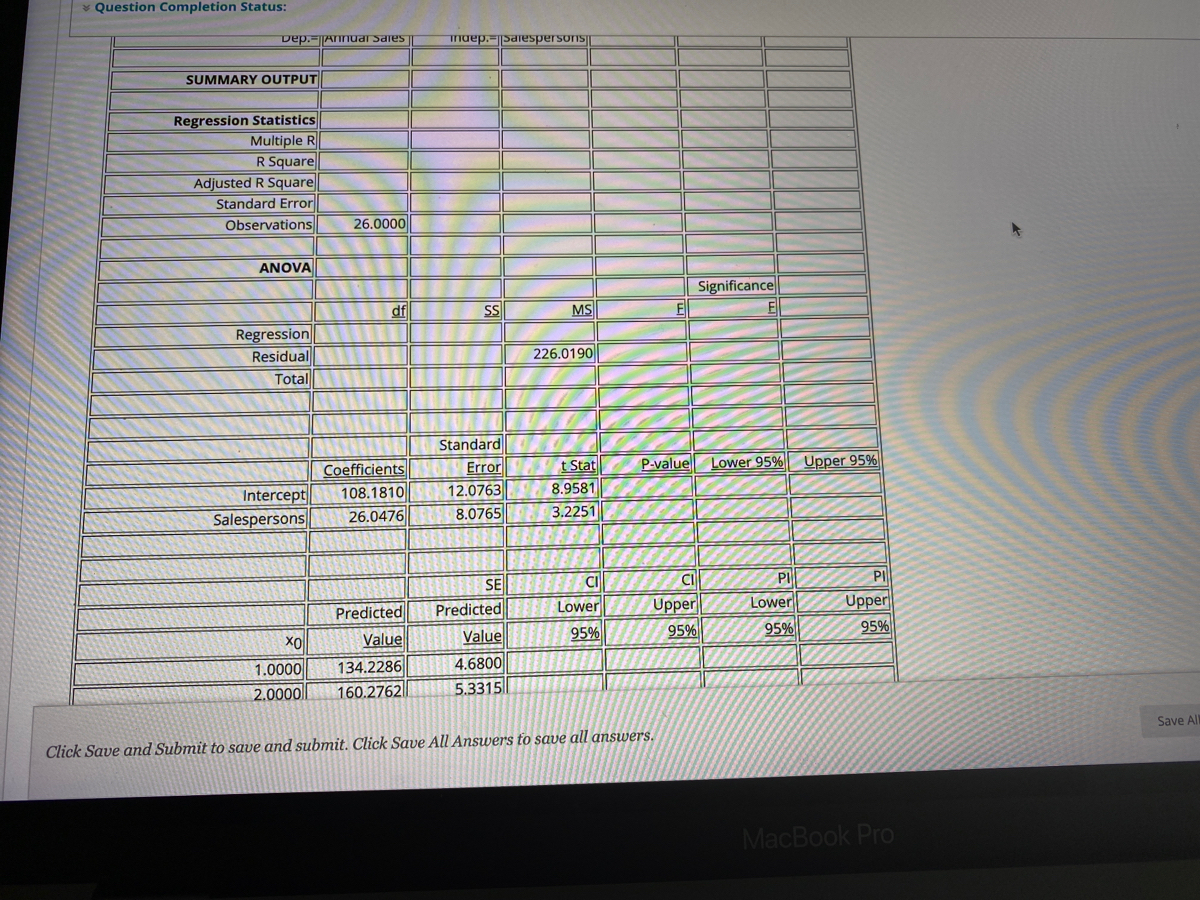
Is there a relationship between the number of Salespersons (units=10 salespersons) at a branch office and Annual Sales (units=$100,000)? Use the excel output
above to answer the following question.
What is the P-value of the Fstat for the hypothesis that tests Ho: B1 = 0?
O a. 0< P-value <.0005
O b. 002 < P-value < :005
O c.0< P-value <.001
O d. 001 < P-value < .0025
e. None of the answers is correct
QUESTION 11
Save
Click Save and Submit to save and submit. Click Save All Answers to save all answers.
MacBook Pro
Expert Solution
This question has been solved!
Explore an expertly crafted, step-by-step solution for a thorough understanding of key concepts.

Step by stepSolved in 3 steps

Knowledge Booster


Learn more about
Need a deep-dive on the concept behind this application? Look no further. Learn more about this topic, statistics and related others by exploring similar questions and additional content below.Similar questions
- 12) The following results are an autoregression for US Exports to Mexico where the dependent variable is the lagged value of US Exports. a) Fill in the table b)Based on these regression results, what is your forecast of US Exports to Mexico for March 2005? c) Which of the two forecasts do you think is more accurate? Explain.arrow_forward3. The residual plots from two different sets of data are graphed below. 0.61 0.4 4- 0.2 3 0- 2 -0.2- 10 12 4. 6. 6. 10 . 12 -0.4- • -0.6 -31 Graph A Graph B Explain, using evidence from graph A and graph B, which graph indicates that the model for the data is a good fit. es MacBook Pro & ) $ 5 7 8 DI { R T Y U %31 F G H J K + II .... L.arrow_forward1. It has been noted that there is a positive correlation between the U.S. economy and the height of women's hemlines (distance from the floor of the bottom of a skirt or dress) with shorter skirts corresponding to economic growth and lower hemlines to periods of economic recession. Comment on the conclusion that economic factors cause hemlines to rise and fall. # of Absences (in weeks) Exam Grade 1 2 345 23 014 90 85 95 92 80arrow_forward
- 4. Summary statistics for the data are shown in the table below. Меan Standard Deviation Iland, x 17.682 1.168 Foot, y 23.318 1.230 Pearson correlation r 0.948 (a) Find the slope by using the formula (b) Find the y-intercept by using the formula a = y – br (c) Find the regresssion equation, using the words "IHand" and "Foot," not r and y. (d) Using the regression equation, predict the foot length (in em) for someone who has a hand length of 18 cm.arrow_forward#6 6.2arrow_forwardQ9. Using the diagram below Deviation from mean of YTSS Error → ESS Explained by regressionRSS Mean of Y Regression line identify the incorrect statement. A. TSS is a measure based on the whole deviation of Y from its mean. В. ESS is based on that part of the deviation of Y not related to the change in X. С. RSS is based on that part of the deviation caused by the change in X. D. At least one of the above statements is False. Ο Α. Α О В. В ОС. С O D. Darrow_forward
- Number 103 part D and Earrow_forward101 a-c pleasearrow_forwardIn Table L-1, the total value of imports of Indonesian goods and services from China for the 2010-2019 period is reported on a quarterly basis. With this data you are asked to analyze it with the Trend model and Seasonal Index. Question: a. Calculate a moving average with the average period length of 4 or MA (4) [why four?] And put the results in a column. Beware of selecting the rows to place the average result. b. Calculate the moving average with the length of the average period is 2 from the data in column MA (4) and the result is given the symbol MA (2x4) and the result is placed in a column. Beware of selecting the rows to place the average result. c. Calculate the ratio to the Moving Average (Y / MA (2x4)) and place it in a new column! d. Calculate a seasonal index and interpret the results! e. Create a Deseasonalized data series and place it in a new column! f. Plot the Dessasonalized data series and read the long-term movement patterns of data! Remember that understanding of…arrow_forward
arrow_back_ios
arrow_forward_ios
Recommended textbooks for you
- MATLAB: An Introduction with ApplicationsStatisticsISBN:9781119256830Author:Amos GilatPublisher:John Wiley & Sons Inc
 Probability and Statistics for Engineering and th...StatisticsISBN:9781305251809Author:Jay L. DevorePublisher:Cengage Learning
 Statistics for The Behavioral Sciences (MindTap C...StatisticsISBN:9781305504912Author:Frederick J Gravetter, Larry B. WallnauPublisher:Cengage Learning
  Elementary Statistics: Picturing the World (7th E...StatisticsISBN:9780134683416Author:Ron Larson, Betsy FarberPublisher:PEARSON
 The Basic Practice of StatisticsStatisticsISBN:9781319042578Author:David S. Moore, William I. Notz, Michael A. FlignerPublisher:W. H. Freeman
 Introduction to the Practice of StatisticsStatisticsISBN:9781319013387Author:David S. Moore, George P. McCabe, Bruce A. CraigPublisher:W. H. Freeman
MATLAB: An Introduction with Applications
Statistics
ISBN:9781119256830
Author:Amos Gilat
Publisher:John Wiley & Sons Inc
Probability and Statistics for Engineering and th...
Statistics
ISBN:9781305251809
Author:Jay L. Devore
Publisher:Cengage Learning
Statistics for The Behavioral Sciences (MindTap C...
Statistics
ISBN:9781305504912
Author:Frederick J Gravetter, Larry B. Wallnau
Publisher:Cengage Learning
Elementary Statistics: Picturing the World (7th E...
Statistics
ISBN:9780134683416
Author:Ron Larson, Betsy Farber
Publisher:PEARSON
The Basic Practice of Statistics
Statistics
ISBN:9781319042578
Author:David S. Moore, William I. Notz, Michael A. Fligner
Publisher:W. H. Freeman
Introduction to the Practice of Statistics
Statistics
ISBN:9781319013387
Author:David S. Moore, George P. McCabe, Bruce A. Craig
Publisher:W. H. Freeman