
Advanced Engineering Mathematics
10th Edition
ISBN: 9780470458365
Author: Erwin Kreyszig
Publisher: Wiley, John & Sons, Incorporated
expand_more
expand_more
format_list_bulleted
Related questions
Concept explainers
Topic Video
Question

Transcribed Image Text:3.
4.
5
Ke'Aria Hackett
October 5, 2020
Name
Unit: Scatter Plots and Data
Student Handout 5
Date
Pd
bth
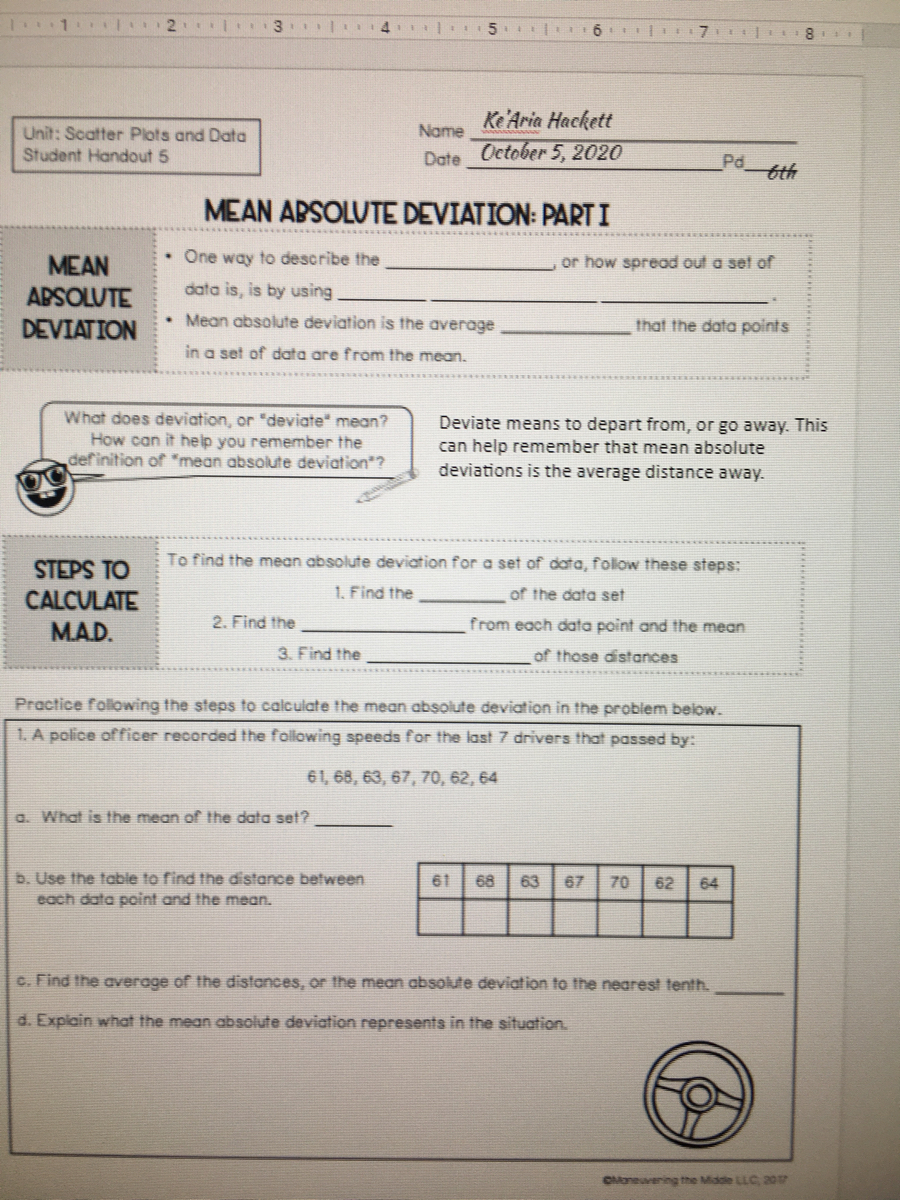
MEAN ABSOLUTE DEVIATION: PARTI
One way to describe the
or how spread out a set of
MEAN
APSOLUTE
data is, is by using
DEVIATION
Mean absolute deviation is the average
that the data points
in a set of data are from the mean.
What does deviation, or "deviate" mean?
How can it help you remember the
definition of *mean absolute deviation"?
Deviate means to depart from, or go away. This
can help remember that mean absolute
deviations is the average distance away.
STEPS TO
To find the mean absolute deviation for a set of data, follow these steps:
1. Find the
of the data set
CALCULATE
MAD.
2. Find the
from each data point and the mean
3. Find the
of those distances
Practice folwing the steps to calculate the mean absolute deviation in the problem below.
1. A police officer recorded the following speeds for the last 7 drivers that passed by:
61, 68, 63, 67, 70, 62, 64
a. What is the mean of the data set?
b. Use the table to find the distance between
each data point and the mean.
61
68
63
67
70
62
64
C. Find the average of the distances, or the mean absolute deviation to the nearest tenth.
d. Explain what the mean absolute deviation represents in the situation.
Expert Solution
This question has been solved!
Explore an expertly crafted, step-by-step solution for a thorough understanding of key concepts.

This is a popular solution

Trending nowThis is a popular solution!

Step by stepSolved in 4 steps

Knowledge Booster


Learn more about
Need a deep-dive on the concept behind this application? Look no further. Learn more about this topic, advanced-math and related others by exploring similar questions and additional content below.Similar questions
- Which of the following best describes the process of finding the interquartile range for a set of data? a.Find the difference between the maximum and the minimum. b.Subtract Q1 from Q3. c.Add the biggest and smallest numbers. d.Place the numbers in order from least to greatest and find the middle.arrow_forwardThe given data set is: 9 5 23 26 11 11 Find the median. Find the mean. Round to one decimal place as needed. Find the mode. If the mode does not exist, please enter DNE. If there are multiple modes, please separate them by space and in increasing ordearrow_forwardPlease, find Arthematic Mean, Geomatric Mean, Harmonic Mean, Mode & Median of the given data. ASAParrow_forward
- 8. Construct a box plot for the following data by finding the min, Q1, median, Q3, the max, and the IQR. 59, 50, 65, 68, 72, 80, 82arrow_forwardQ.5. Find the median if the mean and mode are given as 35 and 30 respectively?arrow_forwardBelow is a box plot showing the ages of actors and actresses. Ages of Oscar Winning Actors from 1975 to 2004 Female E Male 20 40 60 80 100 Age Which has a higher median? data is needed to tell both have the same median actors O actressesarrow_forward
- Would enjoy the help. 4arrow_forwardSolve the problem. The following data gives the number of applicants that applied for a job at a given company each month of 1999: 63, 70, 68, 74, 83, 77, 79, 86, 82, 68, 66, 63. What is the median of the data? O 72 O There is no median. O 70 O 74 W ASUS f4 f5 f6 f7 f8 口京 f9 f10 f11 & 4 7 8. 9. R T Y U 因 5 图arrow_forwardThe top 14 speeds, in miles per hour, for professional drag racing over the past two decades are listed below. Find the median speed. 181.1 202.2 190.1 201.4 201.2 193.2 201.2 194.5 A. 196.1 B. 196.7 C. 201.2 D. 195.8 191.3 201.4 199.2 192.2 196.0 196.2arrow_forward
- Sara creates a box plot using 23,26,44,19,31,39, and 43 . Which one shows the data?arrow_forwardThe following data are the grades of 18 students on an algebra test. 77,74,56,55,85,58,88,71,86,94,63,61,89,61,57,85,93 construct a box-and-whisker plot for the data.arrow_forward6. Find the mean, median, and mode for each set of data. a. 80 90 100 110 110 140 b. 10 90 100 110 110 210 c. How do your answers for parts (a) and (b) differ (or agree)? Why?arrow_forward
arrow_back_ios
SEE MORE QUESTIONS
arrow_forward_ios
Recommended textbooks for you
- Advanced Engineering MathematicsAdvanced MathISBN:9780470458365Author:Erwin KreyszigPublisher:Wiley, John & Sons, Incorporated
 Numerical Methods for EngineersAdvanced MathISBN:9780073397924Author:Steven C. Chapra Dr., Raymond P. CanalePublisher:McGraw-Hill Education
 Introductory Mathematics for Engineering Applicat...Advanced MathISBN:9781118141809Author:Nathan KlingbeilPublisher:WILEY
  Mathematics For Machine TechnologyAdvanced MathISBN:9781337798310Author:Peterson, John.Publisher:Cengage Learning,

Advanced Engineering Mathematics
Advanced Math
ISBN:9780470458365
Author:Erwin Kreyszig
Publisher:Wiley, John & Sons, Incorporated
Numerical Methods for Engineers
Advanced Math
ISBN:9780073397924
Author:Steven C. Chapra Dr., Raymond P. Canale
Publisher:McGraw-Hill Education
Introductory Mathematics for Engineering Applicat...
Advanced Math
ISBN:9781118141809
Author:Nathan Klingbeil
Publisher:WILEY
Mathematics For Machine Technology
Advanced Math
ISBN:9781337798310
Author:Peterson, John.
Publisher:Cengage Learning,