
MATLAB: An Introduction with Applications
6th Edition
ISBN: 9781119256830
Author: Amos Gilat
Publisher: John Wiley & Sons Inc
expand_more
expand_more
format_list_bulleted
Related questions
Question
thumb_up100%
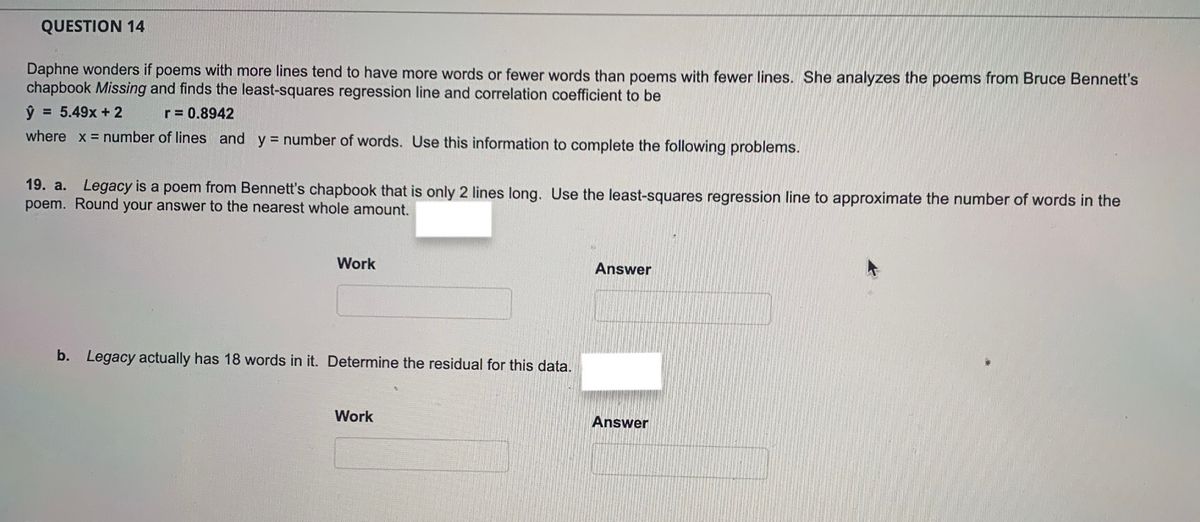

Transcribed Image Text:QUESTION 14
Daphne wonders if poems with more lines tend to have more words or fewer words than poems with fewer lines. She analyzes the poems from Bruce Bennett's
chapbook Missing and finds the least-squares regression line and correlation coefficient to be
= 5.49x + 2
r = 0.8942
where x = number of lines and y = number of words. Use this information to complete the following problems.
19. a. Legacy is a poem from Bennett's chapbook that is only 2 lines long. Use the least-squares regression line to approximate the number of words in the
poem. Round your answer to the nearest whole amount.
Work
Answer
b. Legacy actually has 18 words in it. Determine the residual for this data.
Work
Answer

Transcribed Image Text:20. a.
What percent of the variation is explained by the lest-squares regression line? Round your answer to the nearest tenth of a percent if necessary.
Work
Answer
b. Identify the direction of the data (positive, negative, or none) and enter your answer below.
Answer
Expert Solution
This question has been solved!
Explore an expertly crafted, step-by-step solution for a thorough understanding of key concepts.

Step by stepSolved in 2 steps with 1 images

Knowledge Booster

Similar questions
- The boxplot below shows salaries for Construction workers and Teachers. Construction Teacher 20 25 30 35 40 45 50 Salary (thousands of S) If a person is making the maximum salary for a construction worker, they are making more than what percentage of Teachers?arrow_forwardWhen manually calculating a Mann-Whitney analysis, the first step is to organize your data in numerical order, from lowest to highest. Which of the following statements is true about this step in the analysis process. Group of answer choices The data should be squared before you sum the data. The data from both groups should be combined before ranking the data. The data should be summed (added) before ranking the data. The data should be ranked with each group independently.arrow_forwardA good shipment of product has 3% defective and a bad shipment has 6% of defective.If 50 samples are inspected and the maximum accepted number of defective is 3 units. Determine the producer’s risk. A. 0.065 B. 0.987 C. 0.935 D. 0.353 Thanksarrow_forward
- i need helparrow_forwardA researcher want to know if there is a relationship between sleep and anxiety. The researcher randomly selected n = 5 participants and asked each to rate their sleep quality and anxiety level on a scale of 1 to 5. The data are below: Sleep X Anxiety Y 2 2 3 3 2 2 4 2 5 2 Calculate the Sum of Squares for X (SSX)arrow_forwardHOW Do I solve this in EXCEL In 2016, the Better Business Bureau (BBB) settled 80% of complaints they received in the US. Suppose you have been hired by the BBB to investigate the complains they received this year involving new car dealers. You plan to select a sample of new car dealer complaints to estimate the proportion of complaints the BBB is able to settle. Assume the population proportion of complaints settled for new car dealers is 0.8, the same as the overall proportion of complaints settled in 2016. Suppose you select a sample of 200 complaints involving new car dealers. Show the sampling distribution of pbar. Based on a sample of 200 complaints, what is the probability that the sample proportion will be within 0.04 of the population proportion? Suppose you select a sample of 450 complaints involving new car dealers. Show the sampling distribution of pbar. Based on the smaller sample of only 450 complaints, what is the probability that the sample proportion will be within…arrow_forward
arrow_back_ios
arrow_forward_ios
Recommended textbooks for you
- MATLAB: An Introduction with ApplicationsStatisticsISBN:9781119256830Author:Amos GilatPublisher:John Wiley & Sons Inc
 Probability and Statistics for Engineering and th...StatisticsISBN:9781305251809Author:Jay L. DevorePublisher:Cengage Learning
 Statistics for The Behavioral Sciences (MindTap C...StatisticsISBN:9781305504912Author:Frederick J Gravetter, Larry B. WallnauPublisher:Cengage Learning
  Elementary Statistics: Picturing the World (7th E...StatisticsISBN:9780134683416Author:Ron Larson, Betsy FarberPublisher:PEARSON
 The Basic Practice of StatisticsStatisticsISBN:9781319042578Author:David S. Moore, William I. Notz, Michael A. FlignerPublisher:W. H. Freeman
 Introduction to the Practice of StatisticsStatisticsISBN:9781319013387Author:David S. Moore, George P. McCabe, Bruce A. CraigPublisher:W. H. Freeman
MATLAB: An Introduction with Applications
Statistics
ISBN:9781119256830
Author:Amos Gilat
Publisher:John Wiley & Sons Inc
Probability and Statistics for Engineering and th...
Statistics
ISBN:9781305251809
Author:Jay L. Devore
Publisher:Cengage Learning
Statistics for The Behavioral Sciences (MindTap C...
Statistics
ISBN:9781305504912
Author:Frederick J Gravetter, Larry B. Wallnau
Publisher:Cengage Learning
Elementary Statistics: Picturing the World (7th E...
Statistics
ISBN:9780134683416
Author:Ron Larson, Betsy Farber
Publisher:PEARSON
The Basic Practice of Statistics
Statistics
ISBN:9781319042578
Author:David S. Moore, William I. Notz, Michael A. Fligner
Publisher:W. H. Freeman
Introduction to the Practice of Statistics
Statistics
ISBN:9781319013387
Author:David S. Moore, George P. McCabe, Bruce A. Craig
Publisher:W. H. Freeman