Concept explainers
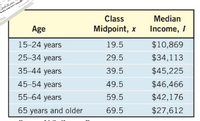
An individual’s income varies with his or her age. The following table shows the
independent variable, x. For the class “65 years and older,” we will assume that the class midpoint is 69.5.
(a) Use a graphing utility to draw a
data. Comment on the type of relation that may exist
between the two variables.
(b) Use a graphing utility to find the quadratic
best fit that models the relation between age and median
income.
(c) Use the function found in part (b) to determine the age at
which an individual can expect to earn the most income.
(d) Use the function found in part (b) to predict the peak
income earned.
(e) With a graphing utility, graph the quadratic function of
best fit on the scatter diagram.

Trending nowThis is a popular solution!
Step by stepSolved in 3 steps with 2 images

- The value(s) that occurs most frequently in a data set is called thearrow_forwardFor the data set: {25, 4, 4, 7, 10, 13, 8, 3, 5, 8, 6, 3, 5. 6, 6, 5, 5, 10, 5, 7, 14, 6, 4} Find the upper and lower outlier boundaries.arrow_forwardThe data represent the number of miles traveled by 10 delivery drivers in a community for one day. What is the first quartile of miles driven? GeoGebra Graphing Calculator 261 215 232 218 218, 223, 211, 299, 231, 245, 261, 278, 212, 233arrow_forward
- website monitors customer complaints and organizes these complaints into six distinct categories. Overthe past year, the company has received 534 complaints One possible graphical method for representing these data is a scatter plot. A. TRUE B. FALSEarrow_forwardHistograms are considered good graphs AND they are used for Qualitative data. O True O Falsearrow_forwardPlease help me identify the median of this data. I have been directed that it is 11 but my own calculations bring me to 13. I do not know what I am doing wrong. What formula should be used.arrow_forward
- 44 35 40 44 44 39 40 47 45 45 44 44 46 Find the mean cost. Select the correct choice below and, if necessary, fill in the answer box to complete your choice. A. The mean cost is (Round to one decimal place as needed.) B. There is no mean cost. Does the mean represent the center of the data? A. The mean represents the center. B. The mean does not represent the center because it is the largest data value. C. The mean does not represent the center because it is not a data value. D. The mean does not represent the center because it is the smallest data value. OE. There is no mean cost. Find the median cost. Select the correct choice below and, if necessary, fill in the answer box to complete your choice. OA. The median cost is (Round to one decimal place as needed.) OB. There is no median cost. 40 0 0 0 Oarrow_forwardBelow are numbers of hours that a sample of 19 recent college graduates reported working last week. 51, 64, 40, 70, 53, 62, 38, 71, 57, 48, 48, 36, 50, 61, 52, 65, 69, 35, 50 Send data to calculator Send data to Excel Using the tool provided, construct a box-and-whisker plot (sometimes called a boxplot) for the data. ? 35 40 45 50 55 60 65 70 75 Number of hours workedarrow_forward
 MATLAB: An Introduction with ApplicationsStatisticsISBN:9781119256830Author:Amos GilatPublisher:John Wiley & Sons Inc
 Probability and Statistics for Engineering and th...StatisticsISBN:9781305251809Author:Jay L. DevorePublisher:Cengage Learning
 Statistics for The Behavioral Sciences (MindTap C...StatisticsISBN:9781305504912Author:Frederick J Gravetter, Larry B. WallnauPublisher:Cengage Learning
 Elementary Statistics: Picturing the World (7th E...StatisticsISBN:9780134683416Author:Ron Larson, Betsy FarberPublisher:PEARSON
 The Basic Practice of StatisticsStatisticsISBN:9781319042578Author:David S. Moore, William I. Notz, Michael A. FlignerPublisher:W. H. Freeman
 Introduction to the Practice of StatisticsStatisticsISBN:9781319013387Author:David S. Moore, George P. McCabe, Bruce A. CraigPublisher:W. H. Freeman


