MATLAB: An Introduction with Applications
6th Edition
ISBN: 9781119256830
Author: Amos Gilat
Publisher: John Wiley & Sons Inc
expand_more
expand_more
format_list_bulleted
Question
thumb_up100%

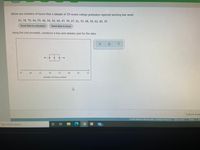
Transcribed Image Text:Below are numbers of hours that a sample of 19 recent college graduates reported working last week.
42, 38, 70, 44, 55, 46, 54, 44, 64, 47, 59, 67, 61, 53, 68, 56, 62, 60, 39
Send data to calculator
Send data to Excel
Using the tool provided, construct a box-and-whisker plot for the data.
十
++++
+++D
35
40
45
50
55
60
65
70
Number of hours worked
Submit Assic
O 2021 McGraw-Hill Education, All Rights Reserved.
Terms of Use Privacy Ac
Type here to search
99+
Expert Solution
This question has been solved!
Explore an expertly crafted, step-by-step solution for a thorough understanding of key concepts.
This is a popular solution
Trending nowThis is a popular solution!
Step by stepSolved in 2 steps with 2 images

Knowledge Booster
Learn more about
Need a deep-dive on the concept behind this application? Look no further. Learn more about this topic, statistics and related others by exploring similar questions and additional content below.Similar questions
- Find the range for the given data set, 22,52,89,63,41,71,14,83,96,12arrow_forwardThe total blood cholesterol level was measured for each of 20 adults. Here are the 20 measurements (in mg/dL). 126, 145, 152, 157, 166, 171, 183, 184, 184, 184, 188, 193, 195, 198, 207, 208, 214, 215, 227, 247 Send data to calculator Frequency 8 6 4 2 0 HA 125 2 4 8 4 150 175 200 Cholesterol level (in mg/dL) (a) For these data, which measures of central tendency take more than one value? Choose all that apply. 225 2 250 Mean Median Mode None of these measuresarrow_forwardSuppose a data set has the following statistics: 25th percentile is 101 75th percentile is 112 The 6 smallest data points in order are 57, 75, 75, 80, 89, 92 If you construct a box plot for this data, where is the bottom of the whisker located? bottom of whisker ->arrow_forward
- Here is a set of 24 values in order: 1, 2, 5, 6, 9, 14, 15, 16, 18, 19, 19, 20, 22, 23, 24, 25, 26, 28, 29, 32, 36, 37, 38, 49 Do not use software for this question. Using your pencil, paper, and perhaps your calculator, determine the values for the 5 Number Summary for this set of data and type your answer into the essay text box.arrow_forwardThe accompanying table represents the average new home size, in square feet, in a country over various years. Construct a display that best represents these data.arrow_forwardWhat level of data does the example represent? Credit Card Numberarrow_forward
arrow_back_ios
SEE MORE QUESTIONS
arrow_forward_ios
Recommended textbooks for you
 MATLAB: An Introduction with ApplicationsStatisticsISBN:9781119256830Author:Amos GilatPublisher:John Wiley & Sons Inc
 Probability and Statistics for Engineering and th...StatisticsISBN:9781305251809Author:Jay L. DevorePublisher:Cengage Learning
 Statistics for The Behavioral Sciences (MindTap C...StatisticsISBN:9781305504912Author:Frederick J Gravetter, Larry B. WallnauPublisher:Cengage Learning
 Elementary Statistics: Picturing the World (7th E...StatisticsISBN:9780134683416Author:Ron Larson, Betsy FarberPublisher:PEARSON
 The Basic Practice of StatisticsStatisticsISBN:9781319042578Author:David S. Moore, William I. Notz, Michael A. FlignerPublisher:W. H. Freeman
 Introduction to the Practice of StatisticsStatisticsISBN:9781319013387Author:David S. Moore, George P. McCabe, Bruce A. CraigPublisher:W. H. Freeman

MATLAB: An Introduction with Applications
Statistics
ISBN:9781119256830
Author:Amos Gilat
Publisher:John Wiley & Sons Inc

Probability and Statistics for Engineering and th...
Statistics
ISBN:9781305251809
Author:Jay L. Devore
Publisher:Cengage Learning

Statistics for The Behavioral Sciences (MindTap C...
Statistics
ISBN:9781305504912
Author:Frederick J Gravetter, Larry B. Wallnau
Publisher:Cengage Learning

Elementary Statistics: Picturing the World (7th E...
Statistics
ISBN:9780134683416
Author:Ron Larson, Betsy Farber
Publisher:PEARSON

The Basic Practice of Statistics
Statistics
ISBN:9781319042578
Author:David S. Moore, William I. Notz, Michael A. Fligner
Publisher:W. H. Freeman

Introduction to the Practice of Statistics
Statistics
ISBN:9781319013387
Author:David S. Moore, George P. McCabe, Bruce A. Craig
Publisher:W. H. Freeman