
MATLAB: An Introduction with Applications
6th Edition
ISBN: 9781119256830
Author: Amos Gilat
Publisher: John Wiley & Sons Inc
expand_more
expand_more
format_list_bulleted
Related questions
Concept explainers
Topic Video
Question

Transcribed Image Text:Examus
cdn.student.uae.examus.net/?rldbqn=1&sessi...
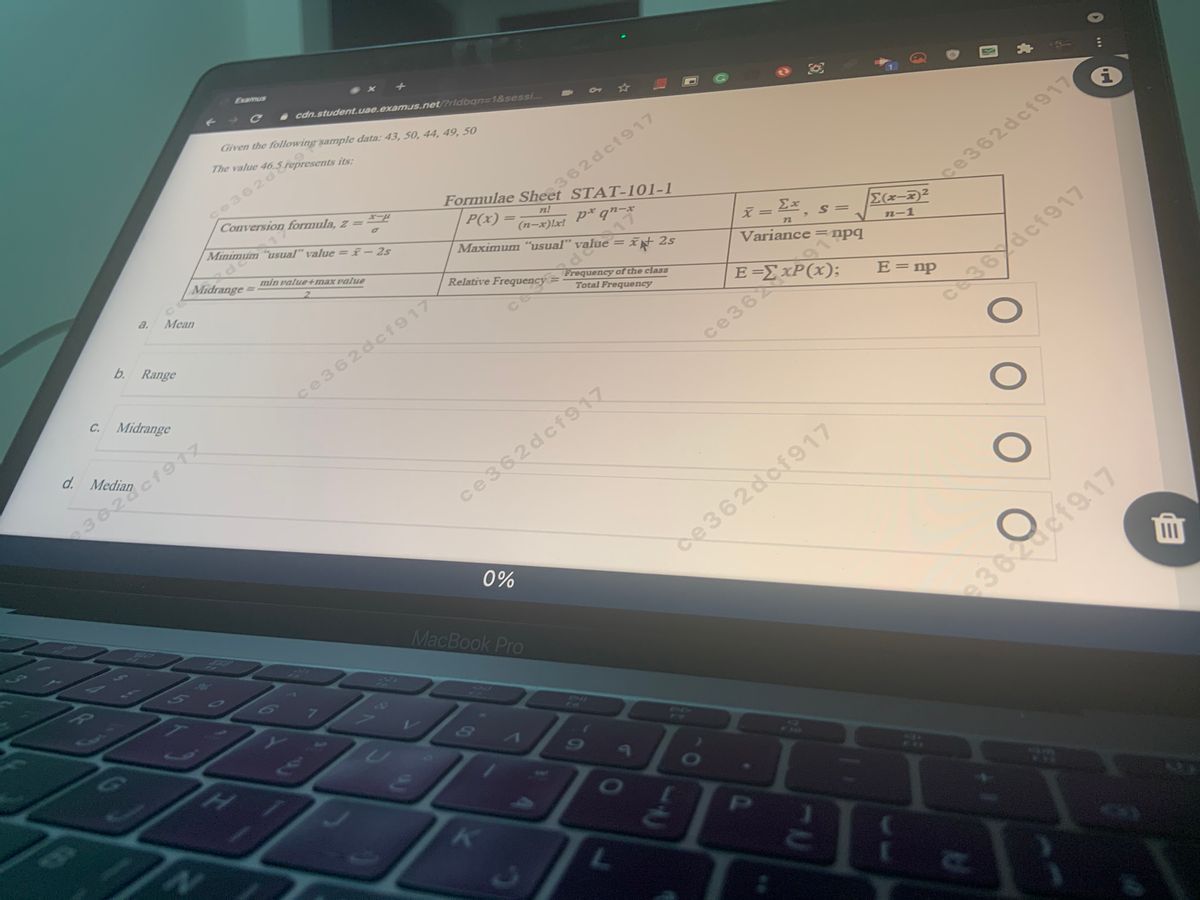
Given the following sample data: 43, 50, 44, 49, 50
The value
362dcf917
Formulae Sheet STAT-101-1
X-X
Conversion formula, z =
Minimum "usual" value = E– 2s
P(x) =
n!
%3D
(n-x)lx!
p* qn-x
%3D
Maximum "usual" value = i† 2s
Ge362dcf917
Midrange =
ī = Ex
Σ-22
min value max value
||
S =
%3D
Variance =npq
n-1
2.
a.
Mean
Total Frequency
E-ΣΧΡx) ;
b. Range
E= np
%3D
ce36Ydcf917
çe362dcf917
ce362
C. Midrange
d. Median
ce362dcf917
0%
ce362dof917
MacBook Pro
e362ucf917
PI
L
Expert Solution
This question has been solved!
Explore an expertly crafted, step-by-step solution for a thorough understanding of key concepts.

Step by stepSolved in 2 steps

Knowledge Booster


Learn more about
Need a deep-dive on the concept behind this application? Look no further. Learn more about this topic, statistics and related others by exploring similar questions and additional content below.Similar questions
- Not yet answered Marked out of 1.00 P Flag question T01 people were interviewed and were asked about the number of bicycles that they had in their hou The results are shown in the table below: Number of Bicycles Frequency 15 1 30 20 3. 15 15 6. What is the median of this set of data? Select one: a. b. 4 OC 3 d. O d. 1 Previous page 4.arrow_forwardDetermine the leaves for the given data points in the range of 80 to 89 for this stem leaf plotarrow_forward← A histogram of the numbers of murders per state in a certain year is shown to the right for the 50 states. Complete parts (a) through (e) below. Frequency 40- 20- Numbers of Murders per State 400 800 1200 1600 2000 2400 2800 3200 Number of murders a. Describe the shape of the distribution. The distribution is unimodal and skewed right. Q A. The class that contains the 50th percentile is 400 to 1119 murders. OB. The class that contains the 50th percentile is murders. Q b. Estimate the number of states that had between 400 and 1199 murders, inclusive. The number of states is approximately 20 c. Identify which class contains the 50th percentile, which is a measure of the center. Choose the correct answer below and fill in the answer box(es) to complete your choice.arrow_forward
- Only answer part C, use Part B and the chart if needed.arrow_forward**Frequency distribution table** The city council was concerned that allowing more bars within city limits would increase the number of drunk drivers on city streets. A researcher was asked to statistically determine how many bar patrons exceed the legal limit for driving when leaving a bar. The researcher asked 20 bar patrons to take a test to determine their blood alcohol levels as they were leaving the bar. The scores are shown below. 0.05 0.08 0.09 0.12 0.03 0.07 0.09 0.12 0.10 0.06 0.10 0.02 0.08 0.00 0.07 0.00 0.14 0.02 0.11 0.10arrow_forwardFor the data listed below, find the following. 72, 70, 95, 91, 99, 95, 93, 80, 84 (a) the mean (b) the median (c) the upper and lower quartiles (d) the five number summary 6. (e) sketch a box-and-whiskers plot for this data **Send in photo for part e*arrow_forward
- movie ratings of one star through five stars are what level of measurements?arrow_forwarded in in the table 2. Find the mean, median, and mode for the following sample of scores: one person the sample 12. A sample One persoi 5 4 5 2 7 1 3 5 ust use the s found stribution nidpoint of students edian, you ates the highest quency. epresen-arrow_forward
arrow_back_ios
arrow_forward_ios
Recommended textbooks for you
- MATLAB: An Introduction with ApplicationsStatisticsISBN:9781119256830Author:Amos GilatPublisher:John Wiley & Sons Inc
 Probability and Statistics for Engineering and th...StatisticsISBN:9781305251809Author:Jay L. DevorePublisher:Cengage Learning
 Statistics for The Behavioral Sciences (MindTap C...StatisticsISBN:9781305504912Author:Frederick J Gravetter, Larry B. WallnauPublisher:Cengage Learning
  Elementary Statistics: Picturing the World (7th E...StatisticsISBN:9780134683416Author:Ron Larson, Betsy FarberPublisher:PEARSON
 The Basic Practice of StatisticsStatisticsISBN:9781319042578Author:David S. Moore, William I. Notz, Michael A. FlignerPublisher:W. H. Freeman
 Introduction to the Practice of StatisticsStatisticsISBN:9781319013387Author:David S. Moore, George P. McCabe, Bruce A. CraigPublisher:W. H. Freeman
MATLAB: An Introduction with Applications
Statistics
ISBN:9781119256830
Author:Amos Gilat
Publisher:John Wiley & Sons Inc
Probability and Statistics for Engineering and th...
Statistics
ISBN:9781305251809
Author:Jay L. Devore
Publisher:Cengage Learning
Statistics for The Behavioral Sciences (MindTap C...
Statistics
ISBN:9781305504912
Author:Frederick J Gravetter, Larry B. Wallnau
Publisher:Cengage Learning
Elementary Statistics: Picturing the World (7th E...
Statistics
ISBN:9780134683416
Author:Ron Larson, Betsy Farber
Publisher:PEARSON
The Basic Practice of Statistics
Statistics
ISBN:9781319042578
Author:David S. Moore, William I. Notz, Michael A. Fligner
Publisher:W. H. Freeman
Introduction to the Practice of Statistics
Statistics
ISBN:9781319013387
Author:David S. Moore, George P. McCabe, Bruce A. Craig
Publisher:W. H. Freeman