MATLAB: An Introduction with Applications
6th Edition
ISBN: 9781119256830
Author: Amos Gilat
Publisher: John Wiley & Sons Inc
expand_more
expand_more
format_list_bulleted
Question

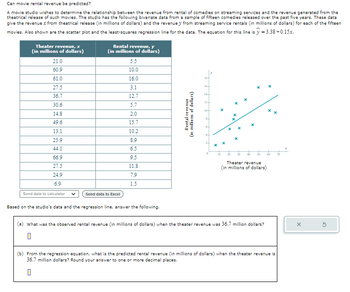
Transcribed Image Text:Can movie rental revenue be predicted?
A movie studio wishes to determine the relationship between the revenue from rental of comedies on streaming services and the revenue generated from the
theatrical release of such movies. The studio has the following bivariate data from a sample of fifteen comedies released over the past five years. These data
give the revenue x from theatrical release (in millions of dollars) and the revenue y from streaming service rentals (in millions of dollars) for each of the fifteen
movies. Also shown are the scatter plot and the least-squares regression line for the data. The equation for this line is ŷ=3.38+0.15x.
Theater revenue, x
(in millions of dollars)
Rental revenue, y
(in millions of dollars)
21.0
5.5
60.9
10.0
61.0
16.0
27.5
3.1
36.7
12.7
30.6
5.7
14.8
2.0
49.6
15.7
13.1
10.2
25.9
8.9
44.1
6.5
66.9
9.5
27.5
11.8
24.9
7.9
6.9
1.5
Send data to calculator
Send data to Excel
Rental revenue
(in millions of dollars)
18-
16+
x
14
12
10+
x
50
60
70
Theater revenue
(in millions of dollars)
Based on the studio's data and the regression line, answer the following.
What was the observed rental revenue (in millions of dollars) when the theater revenue was 36.7 million dollars?
From the regression equation, what is the predicted rental revenue (in millions of dollars) when the theater revenue is
36.7 million dollars? Round your answer to one or more decimal places.
Expert Solution
This question has been solved!
Explore an expertly crafted, step-by-step solution for a thorough understanding of key concepts.
Step by stepSolved in 2 steps with 2 images

Knowledge Booster
Similar questions
- Several years ago, the state of California launched an aggressively advertisement campaign against smoking. We've interviewed students from 16 college campuses in California and recorded for each campus the percentage of students who claimed that they had encountered assay least one anti smoking advertisement on campus in the past month. Here are those percentages. 53 39 30 49 48 42 41 38 26 36 40 42 52 51 45 50 Construct a box and whisker plot for the data.arrow_forwardHow can graphics and/or statistics be used to misrepresent data?arrow_forwardProvide a reason why the classification of data is important.arrow_forward
- Consider the following data. −1,2,2,−4,−4,−1−1,2,2,−4,−4,−1 Determine the mean of the given data.arrow_forwardThe trend of thinner beauty pageant winners has generated charges that the contest encourages unhealthy diet habits among young women. Listed below are body mass indexes (BMI) for beauty pageant winners from two different time periods. Find the coefficient of variation for each of the two sets of data, then compare the variation. The coefficient of variation for the BMI's of beauty pageant winners from the 1920s and 1930s is %arrow_forwardA County Board of Supervisors has appointed an urban planning committee to evaluate proposed community development projects. The committee is analyzing, among other things, data on household incomes in two cities within the county. They have collected data on the income of 77 households in each of the two cities. The histograms below show the distributions of the two sets of incomes (in thousands of dollars). Each histogram shows household income on the horizontal axis and number of households on the vertical axis. The means and standard deviations for the data sets are also given. City A City B 25+ 20+ 15+ 10+ 5- ← 10 20 30 40 50 60 70 80 90 100 City A mean: 73.96 thousand dollars City A standard deviation: 20.30 thousand dollars Explanation 25- 20- 15- 104 5+ 10 (a) Identify the data set for which it is appropriate to use the Empirical Rule. It is appropriate to use the Empirical Rule for the (Choose one) ▼ data set. 20 30 The committee wants to use the Empirical Rule to make some…arrow_forward
arrow_back_ios
arrow_forward_ios
Recommended textbooks for you
 MATLAB: An Introduction with ApplicationsStatisticsISBN:9781119256830Author:Amos GilatPublisher:John Wiley & Sons Inc
 Probability and Statistics for Engineering and th...StatisticsISBN:9781305251809Author:Jay L. DevorePublisher:Cengage Learning
 Statistics for The Behavioral Sciences (MindTap C...StatisticsISBN:9781305504912Author:Frederick J Gravetter, Larry B. WallnauPublisher:Cengage Learning
 Elementary Statistics: Picturing the World (7th E...StatisticsISBN:9780134683416Author:Ron Larson, Betsy FarberPublisher:PEARSON
 The Basic Practice of StatisticsStatisticsISBN:9781319042578Author:David S. Moore, William I. Notz, Michael A. FlignerPublisher:W. H. Freeman
 Introduction to the Practice of StatisticsStatisticsISBN:9781319013387Author:David S. Moore, George P. McCabe, Bruce A. CraigPublisher:W. H. Freeman

MATLAB: An Introduction with Applications
Statistics
ISBN:9781119256830
Author:Amos Gilat
Publisher:John Wiley & Sons Inc

Probability and Statistics for Engineering and th...
Statistics
ISBN:9781305251809
Author:Jay L. Devore
Publisher:Cengage Learning

Statistics for The Behavioral Sciences (MindTap C...
Statistics
ISBN:9781305504912
Author:Frederick J Gravetter, Larry B. Wallnau
Publisher:Cengage Learning

Elementary Statistics: Picturing the World (7th E...
Statistics
ISBN:9780134683416
Author:Ron Larson, Betsy Farber
Publisher:PEARSON

The Basic Practice of Statistics
Statistics
ISBN:9781319042578
Author:David S. Moore, William I. Notz, Michael A. Fligner
Publisher:W. H. Freeman

Introduction to the Practice of Statistics
Statistics
ISBN:9781319013387
Author:David S. Moore, George P. McCabe, Bruce A. Craig
Publisher:W. H. Freeman