MATLAB: An Introduction with Applications
6th Edition
ISBN: 9781119256830
Author: Amos Gilat
Publisher: John Wiley & Sons Inc
expand_more
expand_more
format_list_bulleted
Question
thumb_up100%
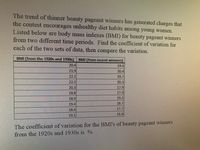
The trend of thinner beauty pageant winners has generated charges that the contest encourages unhealthy diet habits among young women. Listed below are body mass indexes (BMI) for beauty pageant winners from two different time periods. Find the coefficient of variation for each of the two sets of data, then compare the variation.
The coefficient of variation for the BMI's of beauty pageant winners from the 1920s and 1930s is %

Transcribed Image Text:The trend of thinner beauty pageant winners has generated charges that
the contest encourages unhealthy diet habits among young women.
Listed below are body mass indexes (BMI) for beauty pageant winners
from two different time periods. Find the coefficient of variation for
each of the two sets of data, then compare the variation.
BMI (from the 1920s and 1930s) BMI (from recent winners)
20.4
19.6
219
20.4
221
19.7
22.2
20.3
20.3
17.9
18.8
| 17.9
18.9
19.2
18.7
19.4
184
19.1
17.7
16.8
The coefficient of variation for the BMI's of beauty pageant winners
from the 1920s and 1930s is %
Expert Solution
arrow_forward
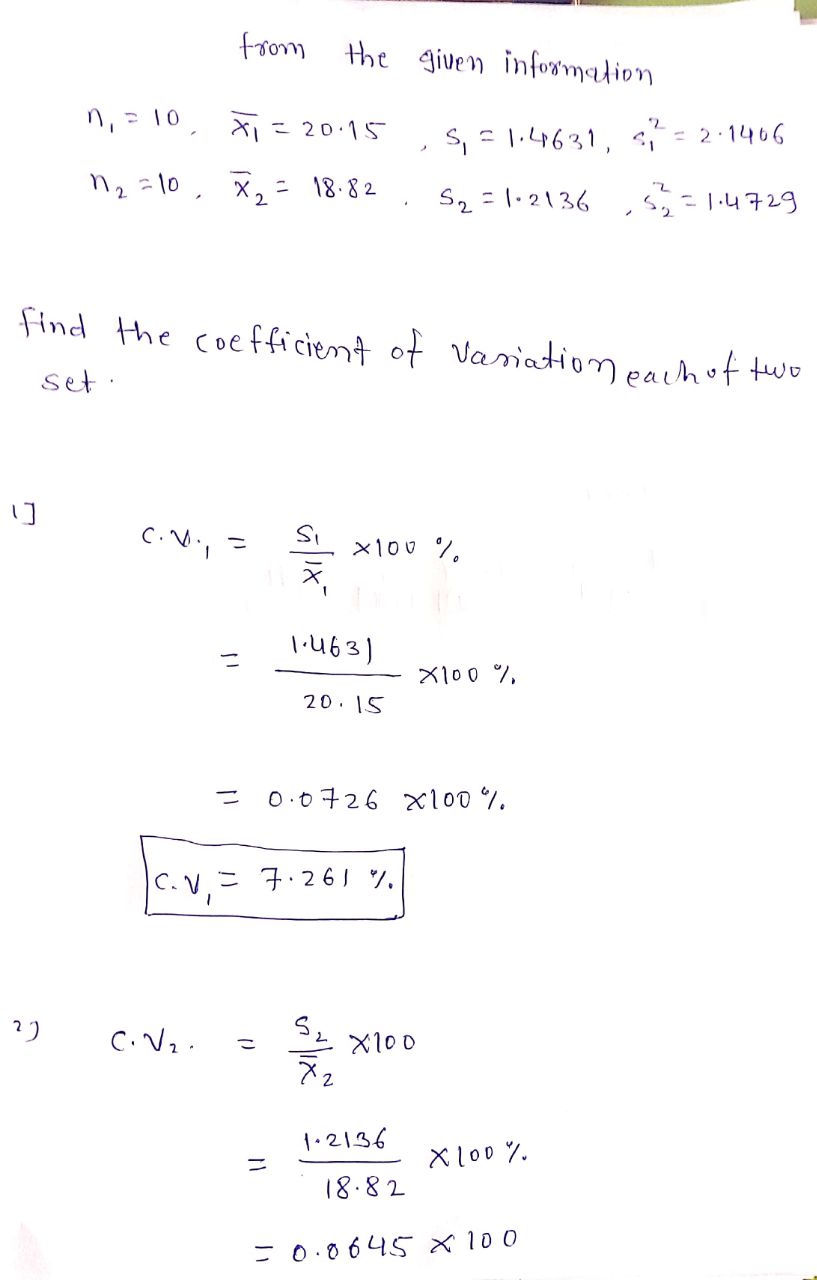
Step 1

Trending nowThis is a popular solution!
Step by stepSolved in 2 steps with 2 images

Knowledge Booster
Similar questions
- A food bank investigates if the number of times their donors walk by a homeless person each week impacts donors’ charitable contribution to the food bank. The data are presented below in standard form. # of homeless people seen each week Donation to food bank Donor ZX ZY 1 -1.3 0.36 2 0.64 -0.09 3 -1.1 1.26 4 -0.14 0.14 5 1.41 -0.54 6 -0.52 -0.09 7 1.03 -1.9 8 0.64 -0.99 9 0.83 0.36 10 -1.49 1.49 What does ΣZXZY equal? A) 941B) 7.86C) -7.16D) -4.44 What is the correlation (Pearson’s r) between the number of homeless people donors see each week and their donation to the food bank (rounded to 2 decimal places)? A) .98B) -.80C) .72D) -.56 What is the obtained t-value for this r? A) -2.96B) -16.35C) -3.72D) -1.89 What are the degrees of freedom? A) 4B) 20C) 8D) 10 What is the critical t-value? A) 3.68B) 2.31C) 2.01D) 3.30 What is your conclusion? A) There is…arrow_forwardListed below are pulse rates (beats per minute) from samples of adult males and females. Find the mean and median for each of the two samples and then compare the two sets of results. Does there appear to be a difference? 86 Male: 73 90 52 57 64 63 55 97 64 95 54 93 61 60 Female: 68 88 93 90 79 65 85 62 91 92 73 90 78 82 75 D C Find the means. The mean for males is beats per minute and the mean for females is beats per minute. (Type integers or decimals rounded to one decimal place as needed.)arrow_forwardState whether the following Scatter plot has: 1- Positive correlation 2- Negative correlation 3 No correlation Next Questionarrow_forward
- Listed below are pulse rates (beats per minute) from samples of adult males and females. Find the mean and median for each of the two samples and then compare the two sets of results. Does there appear to be a difference? Male: 95 77 64 88 62 72 53 82 56 79 53 53 54 76 55 Female: 65 63 87 89 84 76 87 68 93 88 69 93 82 87 70 Find the means. The mean for males is beats per minute and the mean for females is beats per minute. (Type integers or decimals rounded to one decimal place as needed.) Find the medians. The median for males is beats per minute and the median for females is beats per minute. (Type integers or decimals rounded to one decimal place as needed.) Compare the results. Choose the correct answer below. O A. The mean and the median for males are both lower than the mean and the median for females. O B. The mean and the median for females are both lower than the mean and the median for males. O C. The mean and median appear to be roughly the same for both genders. O D. The…arrow_forwardListed below are pulse rates (beats per minute) from samples of adult males and females. Find the mean and median for each of the two samples and then compare the two sets of results. Does there appear to be a difference? Male: Female: 92 69 89 55 95 98 67 55 58 61 57 63 56 55 78 61 64 81 86 89 67 85 88 92 74 92 93 79 78 71 Find the means. The mean for males is beats per minute and the mean for females is (Type integers or decimals rounded to one decimal place as needed.) beats per minute.arrow_forwardListed below are pulse rates (beats per minute) from samples of adult males and females. Find the mean and median for each of the two samples and then compare the two sets of results. Does there appear to be a difference? Male: Female: 81 57 61 80 71 91 63 61 85 77 88 64 59 53 86 54 96 60 82 67 70 85 81 91 84 78 86 69 65 79 Find the means. The mean for males is beats per minute and the mean for females is (Type integers or decimals rounded to one decimal place as needed.) beats per minute.arrow_forward
- first picture is background informationarrow_forwardConsider the following data representing the price of refrigerators (in dollars). 1260, 1446, 1106, 1269, 1443, 1424, 1118, 1132, 1177, 1115, 1156, 1262, 1215, 1236, 1243, 1169, 1437, 1191, 1401, 1439, 1365 Answer Class 1093-1152 1153-1212 1213-1272 1273-1332 1333-1392 1393-1452 Price of Refrigerators (in Dollars) Frequency Relative Frequency Cumulative Frequency Step 3 of 4: Calculate the relative frequency of the sixth class. Determine your answer as a simplified fraction. Tables Keybe Previousarrow_forwardresearcher would like to examine the effect of fertilizer on flower growth. She obtains several flowers. She randomly assigns half the plants to the no fertilizer condition. The other half of the plants receive fertilizer. She monitors their growth for a month. She then compares the amount of growth of the two sets of plants. Is there a difference in growth between the no fertilizer and the fertilizer conditions? Use the .05 level of significance. In addition, find Cohen’s d and state what the effect size is in a sentence. Growth Rating No Fertilizer 40,21,27,30, 47 Fertilizer 46,25, 24, 38, 53arrow_forward
- Consider the following data representing the price of refrigerators (in dollars). 1260, 1446, 1106, 1269, 1443, 1424, 1118, 1132, 1177, 1115, 1156, 1262, 1215, 1236, 1243, 1169, 1437, 1191, 1401, 1439, 1365 Answer Class 1093-1152 1153-1212 1213-1272 1273-1332 1333-1392 1393-1452 Step 2 of 4: Determine the frequency of the first class. Price of Refrigerators (in Dollars) Frequency Relative Frequency Cumulative Frequency Tablesarrow_forwardThe following set of data represents the number of orders filled by a national-chain restaurant during a two week period. Construct a five number summary for the the data. 66, 75, 68, 89, 86, 73, 67, 75, 75, 82, 85, 74, 67, 61 (Round to the nearest hundredth, if needed). Min _________________ Lower Quartile _________________ Median __________________ Upper Quartile _________________ Maximum __________________ What is the range and the interquartile range (IQR)? Range __________________ Interquartile Range (IQR) ___________________arrow_forward2arrow_forward
arrow_back_ios
SEE MORE QUESTIONS
arrow_forward_ios
Recommended textbooks for you
 MATLAB: An Introduction with ApplicationsStatisticsISBN:9781119256830Author:Amos GilatPublisher:John Wiley & Sons Inc
 Probability and Statistics for Engineering and th...StatisticsISBN:9781305251809Author:Jay L. DevorePublisher:Cengage Learning
 Statistics for The Behavioral Sciences (MindTap C...StatisticsISBN:9781305504912Author:Frederick J Gravetter, Larry B. WallnauPublisher:Cengage Learning
 Elementary Statistics: Picturing the World (7th E...StatisticsISBN:9780134683416Author:Ron Larson, Betsy FarberPublisher:PEARSON
 The Basic Practice of StatisticsStatisticsISBN:9781319042578Author:David S. Moore, William I. Notz, Michael A. FlignerPublisher:W. H. Freeman
 Introduction to the Practice of StatisticsStatisticsISBN:9781319013387Author:David S. Moore, George P. McCabe, Bruce A. CraigPublisher:W. H. Freeman

MATLAB: An Introduction with Applications
Statistics
ISBN:9781119256830
Author:Amos Gilat
Publisher:John Wiley & Sons Inc

Probability and Statistics for Engineering and th...
Statistics
ISBN:9781305251809
Author:Jay L. Devore
Publisher:Cengage Learning

Statistics for The Behavioral Sciences (MindTap C...
Statistics
ISBN:9781305504912
Author:Frederick J Gravetter, Larry B. Wallnau
Publisher:Cengage Learning

Elementary Statistics: Picturing the World (7th E...
Statistics
ISBN:9780134683416
Author:Ron Larson, Betsy Farber
Publisher:PEARSON

The Basic Practice of Statistics
Statistics
ISBN:9781319042578
Author:David S. Moore, William I. Notz, Michael A. Fligner
Publisher:W. H. Freeman

Introduction to the Practice of Statistics
Statistics
ISBN:9781319013387
Author:David S. Moore, George P. McCabe, Bruce A. Craig
Publisher:W. H. Freeman