
MATLAB: An Introduction with Applications
6th Edition
ISBN: 9781119256830
Author: Amos Gilat
Publisher: John Wiley & Sons Inc
expand_more
expand_more
format_list_bulleted
Related questions
Question
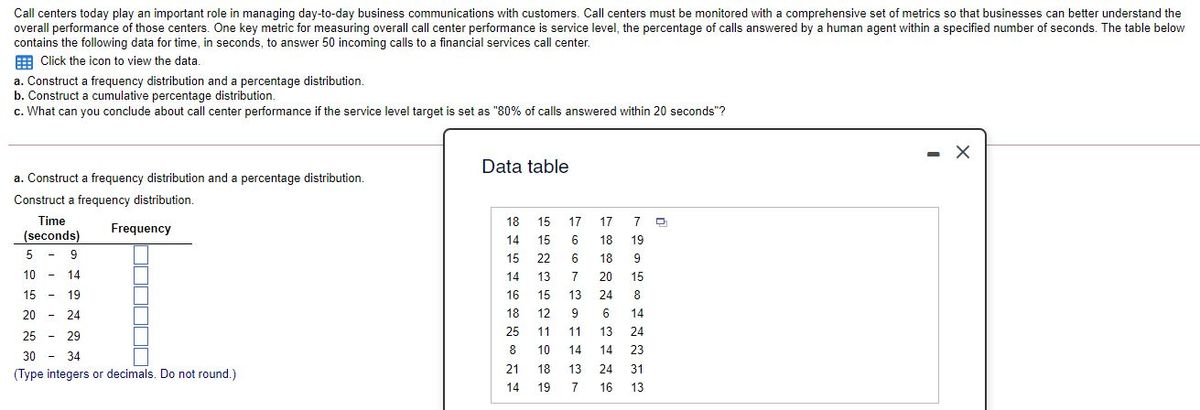

Transcribed Image Text:Call centers today play an important role in managing day-to-day business communications with customers. Call centers must be monitored with a comprehensive set of metrics so that businesses can better understand the
overall performance of those centers. One key metric for measuring overall call center performance is service level, the percentage of calls answered by a human agent within a specified number of seconds. The table below
contains the following data for time, in seconds, to answer 50 incoming calls to a financial services call center.
E Click the icon to view the data.
a. Construct a frequency distribution and a percentage distribution.
b. Construct a cumulative percentage distribution.
c. What can you conclude about call center performance if the service level target is set as "80% of calls answered within 20 seconds"?
- X
Data table
a. Construct a frequency distribution and a percentage distribution.
Construct a frequency distribution.
Time
18
15
17
17
Frequency
(seconds)
14
15
18
19
5
15
22
6
18
9
10 -
14
14
13
7
20
15
15 -
19
16
15
13
24
8.
20
24
18
12
9
6.
14
25
11
11
13
24
25 -
29
8
10
14
14
23
30 - 34
21
18 13
24
31
(Type integers or decimals. Do not round.)
14
19
7
16
13
Expert Solution
This question has been solved!
Explore an expertly crafted, step-by-step solution for a thorough understanding of key concepts.

This is a popular solution

Trending nowThis is a popular solution!

Step by stepSolved in 2 steps

Knowledge Booster

Similar questions
- In the digital age of marketing, special care must be taken to make sure that programmatic ads appearing on websites align with a company's strategy, culture and ethics. For example, in 2017, Nordstrom, Amazon and Whole Foods each faced boycotts from social media users when automated ads for these companies showed up on the Breitbart website (ChiefMarketer.com). It is important for marketing professionals to understand a company's values and culture. The following data are from an experiment designed to investigate the perception of corporate ethical values among individuals specializing in marketing (higher scores indicate higher ethical values). Marketing Managers Marketing Research 5 6 5 6 4 4 = ○ H₂: HMM HMR = HA H₂: HMM # HMR #HA | Ⓒ H₂³ Hmm = HMR = HA 5 5 5 O H₂: HMM# HMR #HA H₂HMM = HMR = HA 4 Find the value of the test statistic. 7.0 4 OH: Not all the population means are equal. H₂: HMM HMR HA 4 H₂: Not all the population means are equal. (a) Use a = 0.05 to test for…arrow_forwardSome research questions are summarized below. For each situation, identify all variables and characterize them in terms of the level of measurement. Identify which variables are dependent and which are independent. a. Are male and female entrepreneurs different in terms of their business success (measured in how much money they made last year)? b. Do years in college change students’ perceptions of their resilience, grit, and perseverance (measured with scales)? c. How do international marriages (marriage between two people from different countries) change over time(measured in years)?arrow_forwardDo #2arrow_forward
- In 2011 home prices and mortgage rates dropped so low that in a number of cities the monthly cost of owning a home was less expensive than renting. The following data show the average asking rent for 10 markets and the monthly mortgage on the median priced home (including taxes and insurance) for 10 cities where the average monthly mortgage payment was less than the average asking rent (The Wall Street Journal, November 26–27, 2011).Click on the datafile logo to reference the data. Enter negative values as negative numbers. a. Develop the estimated regression equation that can be used to predict the monthly mortgage given the average asking rent (to 2 decimals).The regression equation is:Mortgage ($) = + Rent ($)arrow_forwardDetermine whether the following examples are discrete or continuous data sets. Write "DISCRETE" for discrete and "CONTINUOUS" for continuous. (without quotations - use for instance copy and paste to avoid typos) (a) The number of customers waiting in line at the grocery store. answer: (b) The length of time needed for a student to complete a homework assignment. answer: (c) The distance traveled by a city bus each day. answer: (d) The length of time it takes to fill up your gas tank. answer:arrow_forwardThe Federal Bureau of Investigation (FBI), as part of its internal security mission, serves as a database for all the reported crimes committed in the United States. One question that might be of interest is does having more police officers reduce the number of homicides? To investigate this claim, the 2013 data from the twenty largest municipal cities was supplied by the FBI's Uniform Crime Report. Below are two observations from the dataset: > head (cities) City Pop Homicides Police Density MedHome Mayor 1 New York 8175.133 335 4.2595 27016.30 5.5390 1 2 Chicago 2695.598 414 4.4309 11843.58 1.8310 The variables included in the study are: Name of city Population of city in 1,000s of people Number of homicides in the year 2013 Number of police officers per 1,000 people Number of people per square mile Median home price in $100,000 1 if city has a "Strong Mayor" form of government; 0 if not City Рор Homicides Police Density MedHome Мayor Model: log(u;) = Bo + B1Police; + B2MedHome; +…arrow_forward
- A magazine published data on the best small firms in a certain year. These were firms which had been publicly traded for at least a year, have a stock price of at least $5 per share, and have reported annual revenue between $5 million and $1 billion. The table below shows the ages of the chief executive officers for the first 64 ranked firms. Relative Frequency Age 40-44 3 45-49 11 50-54 19 55-59 60-64 10 65-69 2 70-74 1 Frequency Cumulative Relative Frequency (a) What is the frequency for CEO ages between (but not including) 54 and 65? (Enter your answer as a whole number.) 28 (b) What percentage of CEOs are 65 years or older? (Round your answer to the nearest whole number.) 8 (c) What is the relative frequency of ages under 50? (Round your answer to two decimal places.) 0.23 (d) What is the cumulative relative frequency for CEOs younger than 55? (Round your answer to two decimal places.) 0.47 (e) Which graph shows the relative frequency? Relative Frequency 1.0 0.8 0.6 Relative…arrow_forwardThe higher education department of Holmes Institute recorded data on the number of students enrolled in the different study majors for the years 2018 and 2019. Study major 2018 2019 Statistics 1700 2250 Business law 700 900 Accounting 1300 1450 Economics 750 1000 Finance 1450 1758 Marketing management 1069 1189 Auditing 360 351 Use an appropriate graphical technique or chart to compare the number of enrolment in 2018 and 2019 of the different study major. Display the chart. Use an appropriate graphical technique or chart to display the percentage value of the number of enrolment of the different study major in 2018 and 2019. Display the chart.arrow_forwardThe hospital plans to improve patient experience at its facility. As a part of plan, you are provided with the data of ages of patients visiting an orthopaedic department. The head of the hospital needs to know which age group visits the department most to take few improvements in order to make the department more patient friendly. As a hospital administrator, you are required to summarize and present the data using suitable techniques professionally.arrow_forward
- The following tables list the ages of female and male actors when they starred in their award-winning Best Actor performances. (A graphing calculator is recommended.) Ages of Best Female Actor Award Recipients 51 53 65 54 51 75 56 59 61 73 71 31 47 45 41 37 65 70 60 47 31 76 55 65 42 25 69 78 78 53 27 41 41 29 Ages of Best Male Actor Award Recipients 50 59 64 72 71 76 73 43 32 32 43 34 64 47 45 31 46 48 57 57 59 66 64 68 64 61 30 71 55 43 74 65 73 69 (a) Find the mean and the sample standard deviation of the ages of the female recipients. Round each result to the nearest tenth. mean yr sample standard deviation yr (b) Find the mean and the sample standard deviation of the ages of the male recipients. Round each result to the nearest tenth. mean yr sample standard deviation yr (c) Which of the two data sets has the larger mean? female actors male…arrow_forwardThe overnight shipping business has skyrocketed in the last ten years. The single greatest predictor of a company's success is customer service. A study was conducted to determine the customer satisfaction levels for one overnight shipping business. In addition to the customer's satisfaction level, the customers were asked how often they used overnight shipping. The results are shown in the following table: 1. Satisfaction level Frequency of Use 5 per month TOTAL 100 70 25 220 460 20 700 Suppose that one customer who participated in the study is chosen at random. What is the probability that the customer had a low level of satisfaction and used the company less than two times per month?arrow_forwardMany freeways have service (or logo) signs that give information on attractions, camping, lodging, food, and gas services prior to off-ramps. These signs typically do not provide information on distances. An article reported that in one investigation, six sites along interstate highways where service signs are posted were selected. For each site, crash data was obtained for a three-year period before distance information was added to the service signs and for a one-year period afterward. The number of crashes per year before and after the sign changes were as follows. Before: 14 29 62 123 64 62 After: 15 27 41 84 76 71 (a) The article included the statement "A paired t test was performed to determine whether there was any change in the mean number of crashes before and after the addition of distance information on the signs." Carry out such a test. [Note: The relevant normal probability plot shows a substantial linear pattern.] State and test the appropriate hypotheses. (Use a = 0.05.)…arrow_forward
arrow_back_ios
SEE MORE QUESTIONS
arrow_forward_ios
Recommended textbooks for you
- MATLAB: An Introduction with ApplicationsStatisticsISBN:9781119256830Author:Amos GilatPublisher:John Wiley & Sons Inc
 Probability and Statistics for Engineering and th...StatisticsISBN:9781305251809Author:Jay L. DevorePublisher:Cengage Learning
 Statistics for The Behavioral Sciences (MindTap C...StatisticsISBN:9781305504912Author:Frederick J Gravetter, Larry B. WallnauPublisher:Cengage Learning
  Elementary Statistics: Picturing the World (7th E...StatisticsISBN:9780134683416Author:Ron Larson, Betsy FarberPublisher:PEARSON
 The Basic Practice of StatisticsStatisticsISBN:9781319042578Author:David S. Moore, William I. Notz, Michael A. FlignerPublisher:W. H. Freeman
 Introduction to the Practice of StatisticsStatisticsISBN:9781319013387Author:David S. Moore, George P. McCabe, Bruce A. CraigPublisher:W. H. Freeman
MATLAB: An Introduction with Applications
Statistics
ISBN:9781119256830
Author:Amos Gilat
Publisher:John Wiley & Sons Inc
Probability and Statistics for Engineering and th...
Statistics
ISBN:9781305251809
Author:Jay L. Devore
Publisher:Cengage Learning
Statistics for The Behavioral Sciences (MindTap C...
Statistics
ISBN:9781305504912
Author:Frederick J Gravetter, Larry B. Wallnau
Publisher:Cengage Learning
Elementary Statistics: Picturing the World (7th E...
Statistics
ISBN:9780134683416
Author:Ron Larson, Betsy Farber
Publisher:PEARSON
The Basic Practice of Statistics
Statistics
ISBN:9781319042578
Author:David S. Moore, William I. Notz, Michael A. Fligner
Publisher:W. H. Freeman
Introduction to the Practice of Statistics
Statistics
ISBN:9781319013387
Author:David S. Moore, George P. McCabe, Bruce A. Craig
Publisher:W. H. Freeman