
Essentials Of Investments
11th Edition
ISBN: 9781260013924
Author: Bodie, Zvi, Kane, Alex, MARCUS, Alan J.
Publisher: Mcgraw-hill Education,
expand_more
expand_more
format_list_bulleted
Question
thumb_up100%
Calculating par values against the dollar and gold. In 1958, the French franc (FF) was defined as worth 1/175 ounce of gold. What was the FF’s par value against the dollar? What were the floor and ceiling exchange rates within which the French franc was allowed to fluctuate?
I have added multiple images from the textbook for your reference to see if you can find the solution. Please check the images.
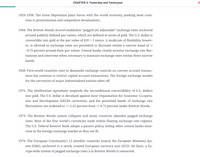
Transcribed Image Text:CHAPTER 3: Yesterday and Yesteryear
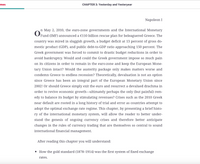
1929–1938: The Great Depression plays havoc with the world economy, pushing most coun-
tries to protectionism and competitive devaluations.
1944: The Bretton Woods Accord establishes "pegged yet adjustable" exchange rates anchored
around publicly defined par values, which are defined in terms of gold. The U.S. dollar is
convertible into gold at the par value of $35 = 1 ounce. A modicum of flexibility, howev-
er, is allowed as exchange rates are permitted to fluctuate within a narrow band of +/
-0.75 percent around their par values. Central banks closely monitor exchange rate fluc-
tuations and intervene when necessary to maintain exchange rates within these narrow
bands.
1958: First-world countries start to dismantle exchange controls on current account transac-
tions but continue to restrict capital account transactions. The foreign exchange market
for the currencies of major industrialized nations takes off.
1971: The Smithsonian Agreement suspends the unconditional convertibility of U.S. dollars
into gold. The U.S. dollar is devalued against most Organisation for Economic Co-opera-
tion and Development (OECD) currencies, and the permitted bands of exchange rate
fluctuations are widened to +/-2.25 percent from +/-0.75 percent under Bretton Woods.
1973: The Bretton Woods system collapses and many countries abandon pegged exchange
rates. Most of the first world's currencies trade within floating exchange rate regimes.
The U.S. Federal Reserve Bank adopts a passive policy, letting other central banks inter-
vene in the foreign exchange market as they see fit.
1979: The European Community's 12 member countries launch the European Monetary Sys-
tem (EMS), anchored to a newly created European currency unit (ECU). De facto, a Eu-
rope-wide system of pegged exchange rates à la Bretton Woods is reenacted.
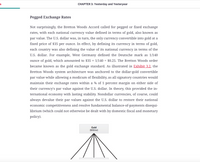
Transcribed Image Text:CHAPTER 3: Yesterday and Yesteryear
Pegged Exchange Rates
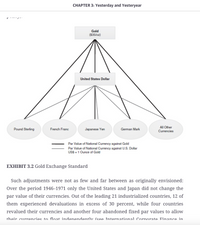
Not surprisingly, the Bretton Woods Accord called for pegged or fixed exchange
rates, with each national currency value defined in terms of gold, also known as
par value. The U.S. dollar was, in turn, the only currency convertible into gold at a
fixed price of $35 per ounce. In effect, by defining its currency in terms of gold,
each country was also defining the value of its national currency in terms of the
U.S. dollar. For example, West Germany defined the Deutsche mark as 1/140
ounce of gold, which amounted to $35 × 1/140 = $0.25. The Bretton Woods order
%3D
became known as the gold exchange standard. As illustrated in Exhibit 3.2, the
Bretton Woods system architecture was anchored to the dollar-gold convertible
par value while allowing a modicum of flexibility, as all signatory countries would
maintain their exchange rates within a ¾ of 1 percent margin on either side of
their currency's par value against the U.S. dollar. In theory, this provided the in-
ternational economy with lasting stability. Nondollar currencies, of course, could
always devalue their par values against the U.S. dollar to restore their national
economic competitiveness and resolve fundamental balance-of-payments disequi-
librium (which could not otherwise be dealt with by domestic fiscal and monetary
policy).
Gold
($35/oz)
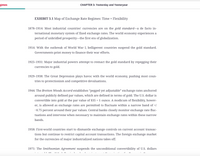
Transcribed Image Text:gimes
CHAPTER 3: Yesterday and Yesteryear
EXHIBIT 3.1 Map of Exchange Rate Regimes: Time × Flexibility
1878–1914: Most industrial countries' currencies are on the gold standard-a de facto in-
ternational monetary system of fixed exchange rates. The world economy experiences a
period of unbridled prosperity-the first era of globalization.
1914: With the outbreak of World War I, belligerent countries suspend the gold standard.
Governments print money to finance their war efforts.
1925–1931: Major industrial powers attempt to reenact the gold standard by repegging their
currencies to gold.
1929–1938: The Great Depression plays havoc with the world economy, pushing most coun-
tries to protectionism and competitive devaluations.
1944: The Bretton Woods Accord establishes “pegged yet adjustable" exchange rates anchored
around publicly defined par values, which are defined in terms of gold. The U.S. dollar is
convertible into gold at the par value of $35 = 1 ounce. A modicum of flexibility, howev-
er, is allowed as exchange rates are permitted to fluctuate within a narrow band of +/
-0.75 percent around their par values. Central banks closely monitor exchange rate fluc-
tuations and intervene when necessary to maintain exchange rates within these narrow
bands.
1958: First-world countries start to dismantle exchange controls on current account transac-
tions but continue to restrict capital account transactions. The foreign exchange market
for the currencies of major industrialized nations takes off.
1971: The Smithsonian Agreement suspends the unconditional convertibility of U.S. dollars
Transcribed Image Text:CHAPTER 3: Yesterday and Yesteryear
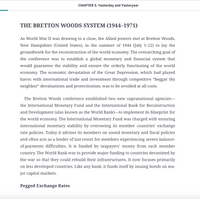
THE BRETTON WOODS SYSTEM (1944–1971)
As World War II was drawing to a close, the Allied powers met at Bretton Woods,
New Hampshire (United States), in the summer of 1944 (July 1-22) to lay the
groundwork for the reconstruction of the world economy. The overarching goal of
the conference was to establish a global monetary and financial system that
would guarantee the stability and ensure the orderly functioning of the world
economy. The economic devastation of the Great Depression, which had played
havoc with international trade and investment through competitive "beggar thy
neighbor" devaluations and protectionism, was to be avoided at all costs.
The Bretton Woods conference established two new supranational agencies-
the International Monetary Fund and the International Bank for Reconstruction
and Development (also known as the World Bank)–to implement its blueprint for
the world economy. The International Monetary Fund was charged with ensuring
international monetary stability by overseeing its member countries' exchange
rate policies. Today it advises its members on sound monetary and fiscal policies
and often acts as a lender of last resort for members experiencing severe balance-
of-payments difficulties. It is funded by taxpayers' money from each member
country. The World Bank was to provide major funding to countries devastated by
the war so that they could rebuild their infrastructures. It now focuses primarily
on less developed countries. Like any bank, it funds itself by issuing bonds on ma-
jor capital markets.
Pegged Exchange Rates
Transcribed Image Text:mes
CHAPTER 3: Yesterday and Yesteryear
Napoleon I
n May 2, 2010, the euro-zone governments and the International Monetary
OFund (IMF) announced a €110 billion rescue plan for beleaguered Greece. The
country was mired in sluggish growth, a budget deficit at 13 percent of gross do-
mestic product (GDP), and public debt-to-GDP ratio approaching 150 percent. The
Greek government was forced to commit to drastic budget reductions in order to
avoid bankruptcy. Would and could the Greek government impose so much pain
on its citizens in order to remain in the euro-zone and keep the European Mone-
tary Union intact? Would the austerity package only makes matters worse and
condemn Greece to endless recession? Theoretically, devaluation is not an option
since Greece has been an integral part of the European Monetary Union since
2002! Or should Greece simply exit the euro and resurrect a devalued drachma in
order to revive economic growth–ultimately perhaps the only (but painful) rem-
edy to balance its budget by stimulating revenues? Crises such as the 2010 Greek
near default are rooted in a long history of trial and error as countries attempt to
adopt the optimal exchange rate regime. This chapter, by presenting a brief histo-
ry of the international monetary system, will allow the reader to better under-
stand the genesis of ongoing currency crises and therefore better anticipate
changes in the rules of currency trading that are themselves so central to sound
international financial management.
After reading this chapter you will understand:
• How the gold standard (1878–1914) was the first system of fixed exchange
rates.
Transcribed Image Text:CHAPTER 3: Yesterday and Yesteryear
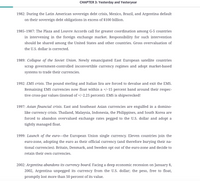
1982: During the Latin American sovereign debt crisis, Mexico, Brazil, and Argentina default
on their sovereign debt obligations in excess of $100 billion.
1985–1987: The Plaza and Louvre Accords call for greater coordination among G-5 countries
in intervening in the foreign exchange market. Responsibility for such intervention
should be shared among the United States and other countries. Gross overvaluation of
the U.S. dollar is corrected.
1989: Collapse of the Soviet Union. Newly emancipated East European satellite countries
scrap government-controlled inconvertible currency regimes and adopt market-based
systems to trade their currencies.
1992: EMS crisis. The pound sterling and Italian lira are forced to devalue and exit the EMS.
Remaining EMS currencies now float within a +/-15 percent band around their respec-
tive cross-par values (instead of +/-2.25 percent). EMS is shipwrecked!
1997: Asian financial crisis. East and Southeast Asian currencies are engulfed in a domino-
like currency crisis. Thailand, Malaysia, Indonesia, the Philippines, and South Korea are
forced to abandon overvalued exchange rates pegged to the U.S. dollar and adopt a
tightly managed float.
1999: Launch of the euro-the European Union single currency. Eleven countries join the
euro-zone, adopting the euro as their official currency (and therefore burying their na-
tional currencies). Britain, Denmark, and Sweden opt out of the euro-zone and decide to
retain their own currencies.
2002: Argentina abandons its currency board. Facing a deep economic recession on January 8,
2002, Argentina unpegged its currency from the U.S. dollar; the peso, free to float,
promptly lost more than 50 percent of its value.
Transcribed Image Text:nes
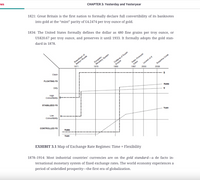
1821: Great Britain is the first nation to formally declare full convertibility of its banknotes
CHAPTER 3: Yesterday and Yesteryear
into gold at the “mint" parity of £4.2474 per troy ounce of gold.
1834: The United States formally defines the dollar as 480 fine grains per troy ounce, or
US$20.67 per troy ounce, and preserves it until 1933. It formally adopts the gold stan-
dard in 1878.
Вreakdown of
Bretton Woods
Collap se of Soviet
Empire
European
Asian Financial
Crisis
Clean
Monetary System
Subprime Crisis
2008
FLOATING FX
Launch of €
2000
Dirty
High
Convertibility
STABILIZED FX
Ruble
Low
¥-.
Convertibility
CONTROLLED FX
Yuan
Ruble
Yuan
EXHIBIT 3.1 Map of Exchange Rate Regimes: Time × Flexibility
1878–1914: Most industrial countries' currencies are on the gold standard-a de facto in-
ternational monetary system of fixed exchange rates. The world economy experiences a
period of unbridled prosperity–the first era of globalization.
![CHAPTER 3: Yesterday and Yesteryear
Maximum divergence = 0.0225 × [1 – w;(0)]
%3D
A good warning indicator should sound a warning signal before a currency
reaches its maximum divergence: By setting arbitrary threshold divergence at 75
percent of maximum divergence, we can define the threshold divergence indica-
tor effectively used by the EMS:
Threshold divergence = 0.075 × 0.0225 × [1 – w;(0)]
Q: If, for example, the French franc (FF) accounts for 15 percent of the value of one ECU, what
is its threshold divergence indicator?
A: Based on the threshold divergence equation, it will be less than the +/-2.25 percent mandat-
ed by the EMS grid of par values. It will also be less than the 75 percent of 2.25 percent. It will
reflect the weight of the FF in the ECU of w;(0) = 0.15 and is readily computed as:
(0.075) x (0.0225) × (1 – 0.15) = 0.0143 or 1.43%
which is considerably less than the +/-2.25 percent margin.
The EMS Straitjacket Comes Unglued
In spite of the EMS's lofty ambition of providing a zone of monetary stability to
the European Community, most member nations currencies' (with the exception
of the Dutch guilder) devalued by at least 20 percent against the Deutsche mark
between 1979 and 1987. The French franc alone devalued by more than 50 per-
cent against the Deutsche mark, and the Italian lira did not fare any better. The
severe currency crisis in the summer of 1992 hastened the demise of the EMS. The](https://content.bartleby.com/qna-images/question/50fbc884-4de6-47bb-a045-4d2caa13a541/b9c7b134-f8d9-47b7-afce-e27affd22c54/bk8mu5h_thumbnail.png)
Transcribed Image Text:CHAPTER 3: Yesterday and Yesteryear
Maximum divergence = 0.0225 × [1 – w;(0)]
%3D
A good warning indicator should sound a warning signal before a currency
reaches its maximum divergence: By setting arbitrary threshold divergence at 75
percent of maximum divergence, we can define the threshold divergence indica-
tor effectively used by the EMS:
Threshold divergence = 0.075 × 0.0225 × [1 – w;(0)]
Q: If, for example, the French franc (FF) accounts for 15 percent of the value of one ECU, what
is its threshold divergence indicator?
A: Based on the threshold divergence equation, it will be less than the +/-2.25 percent mandat-
ed by the EMS grid of par values. It will also be less than the 75 percent of 2.25 percent. It will
reflect the weight of the FF in the ECU of w;(0) = 0.15 and is readily computed as:
(0.075) x (0.0225) × (1 – 0.15) = 0.0143 or 1.43%
which is considerably less than the +/-2.25 percent margin.
The EMS Straitjacket Comes Unglued
In spite of the EMS's lofty ambition of providing a zone of monetary stability to
the European Community, most member nations currencies' (with the exception
of the Dutch guilder) devalued by at least 20 percent against the Deutsche mark
between 1979 and 1987. The French franc alone devalued by more than 50 per-
cent against the Deutsche mark, and the Italian lira did not fare any better. The
severe currency crisis in the summer of 1992 hastened the demise of the EMS. The
Transcribed Image Text:CHAPTER 3: Yesterday and Yesteryear
Ule ECU was useu by private-sector IIITIS IOI IIVOICIng trade Conracts UI uenoImaung boNUS
issues.
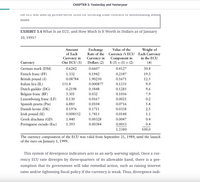
EXHIBIT 3.4 What Is an ECU, and How Much Is It Worth in Dollars as of January
10, 1991?
Exchange
Rate of the Currency i's ECU Each Currency
Currency in
Dollars (2) $ (3) = (1) × (2)
Amount
Value of the
Weight of
of Each
Currency in
One ECU (1)
Component in
in the ECU
Currency
(4)
German mark (DM)
0.6242
0.6607
0.4127
30.8
French franc (FF)
1.332
0.1942
0.2587
19.3
British pound (£)
Italian lira (IL)
0.08784
1.90250
0.1671
12.5
151.8
0.000877
0.1331
9.9
Dutch guilder (DG)
Belgian franc (BF)
Luxembourg franc (LF)
Spanish peseta (Pta)
Danish krone (DK)
Irish pound (I£)
0.2198
0.5848
0.1285
9.6
3.301
0.032
0.1056
7.9
0.130
0.0167
0.0021
0.2
6.885
0.0104
0.0716
5.4
0.1976
0.1711
0.0338
2.5
0.008552
1.7415
0.0148
1.1
Greek drachma (GD)
1.440
0.00328
0.0047
0.4
Portuguese escudo (Esc)
1.393
0.00384
0.0053
0.4
1.3380
100.0
The currency composition of the ECU was valid from September 21, 1989, until the launch
of the euro on January 1, 1999.
This system of divergence indicators acts as an early warning signal. Once a cur-
rency ECU rate diverges by three-quarters of its allowable band, there is a pre-
sumption that its government will take remedial action, such as raising interest
rates and/or tightening fiscal policy if the currency is weak. Thus, divergence indi-
Transcribed Image Text:CHAPTER 3: Yesterday and Yesteryear
um excnange rate woula be close to the official par value. That is wnen central
banks started to play a critical role in stabilizing exchange rates at their pre-
scribed par values through intervention in the foreign exchange market.
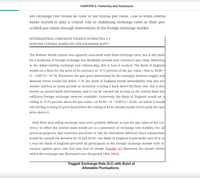
INTERNATIONAL CORPORATE FINANCE IN PRACTICE 3.1
HOW DID CENTRAL BANKS PEG THE EXCHANGE RATE?
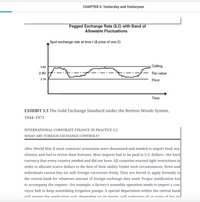
The Bretton Woods system was squarely associated with fixed exchange rates, but it did allow
for a modicum of foreign exchange rate flexibility around each currency's par value. Referring
to the dollar-sterling exchange rate relationship, this is how it worked: The Bank of England
would set a floor for the price of its currency at -0.75 percent of the par value-that is, $2.80 ×
(1 - 0.0075) = $2.78. Whenever the spot price determined by the interplay between supply and
demand forces would fall below 2.78, the Bank of England would immediately step into the
market and buy as many pounds as necessary to bring it back above the floor rate; this is also
known as central bank intervention, and it can be carried out as long as the central bank has
sufficient foreign exchange reserves available. Conversely, the Bank of England would set a
ceiling at +0.75 percent above the par value-or $2.80 ×x (1 + 0.0075) = $2.82–at which it would
sell sterling to bring its price back below the ceiling of $2.82 should market forces push the spot
price above it.
Both floor and ceiling exchange rates were publicly defined, as was the par value of the cur-
rency: In effect the central bank would act as a guarantor of exchange rate stability. For all
practical purposes, spot (currency purchase or sale for immediate delivery) forex transactions
would be carried out between $2.78 and $2.82–the Bank of England would make sure of it; in
a way the Bank of England provided all participants in the foreign exchange market with in-
surance against price risk that was free of charge (Exhibit 3.3 illustrates the tunnel within
which the exchange rate fluctuated over the period 1964–1965).
Pegged Exchange Rate ($,£) with Band of
Allowable Fluctuations
Transcribed Image Text:CHAPTER 3: Yesterday and Yesteryear
r ----, -
Gold
($35/oz)
United States Dollar
All Other
Currencies
Pound Sterling
French Franc
Japanese Yen
German Mark
Par Value of National Currency against Gold
Par Value of National Currency against U.S. Dollar
USS = 1 Ounce of Gold
EXHIBIT 3.2 Gold Exchange Standard
Such adjustments were not as few and far between as originally envisioned:
Over the period 1946–1971 only the United States and Japan did not change the
par value of their currencies. Out of the leading 21 industrialized countries, 12 of
them experienced devaluations in excess of 30 percent, while four countries
revalued their currencies and another four abandoned fixed par values to allow
their currencies to float indenendently (cee International Cornorate Finance in
Transcribed Image Text:CHAPTER 3: Yesterday and Yesteryear
Pegged Exchange Rate ($,£) with Band of
Allowable Fluctuations
Spot exchange rate at time t ($ price of one £)
2.82
,Ceiling
2.80
Par value
2.78
Floor
Time
EXHIBIT 3.3 The Gold Exchange Standard under the Bretton Woods System,
1944–1971
INTERNATIONAL CORPORATE FINANCE IN PRACTICE 3.2
WHAT ARE FOREIGN EXCHANGE CONTROLS?
After World War II most countries' economies were devastated and needed to import food, ma-
chinery, and fuel to revive their fortunes. Most imports had to be paid in U.S. dollars-the hard
currency
that every country needed and did not have. All countries enacted tight restrictions in
order to allocate scarce dollars to the best of their ability. Under such circumstances, firms and
individuals cannot buy (or sell) foreign currencies freely. They are forced to apply formally to
the central bank for whatever amount of foreign exchange they need. Proper justification has
to accompany the request-for example, a factory's assembly operation needs to import a con-
veyor belt to keep assembling irrigation pumps. A special department within the central bank
Twill review the annlication and denending on its merits. will authorize all or some of the re.
Transcribed Image Text:es
CHAPTER 3: Yesterday and Yesteryear
IMIO one sIngie currency uiat joImned ne clUD OI Independent l1oaters; il Is Loday
the second most widely traded currency.
Clean Float
↑
Managed Float
↑
China (2007)
Crawling Peg
↑
Stabilized
↑
China (1997)
Controlled
Low
Convertibility
High
Controls on Current
Limited Controls on
and Capital Accounts
Capital Account
EXHIBIT 3.5 Flexibility x Convertibility Space with Clusters of Currencies
Flexibility
High
MO7
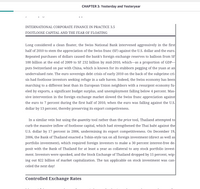
Transcribed Image Text:CHAPTER 3: Yesterday and Yesteryear
INTERNATIONAL CORPORATE FINANCE IN PRACTICE 3.5
FOOTLOOSE CAPITAL AND THE FEAR OF FLOATING
Long considered a clean floater, the Swiss National Bank intervened aggressively in the first
half of 2010 to stem the appreciation of the Swiss franc (SF) against the U.S. dollar and the euro.
Repeated purchases of dollars caused the bank's foreign exchange reserves to balloon from SF
100 billion at the end of 2009 to SF 232 billion by mid-2010, which-as a proportion of GDP-
puts Switzerland on par with China, which is known for its stubborn pegging of the yuan at an
undervalued rate. The euro sovereign debt crisis of early 2010 on the back of the subprime cri-
sis had footloose investors seeking refuge in a safe haven. Indeed, the Swiss economy has been
marching to a different beat than its European Union neighbors with a resurgent economy fu-
eled by exports, a significant budget surplus, and unemployment falling below 4 percent. Mas-
sive intervention in the foreign exchange market slowed the Swiss franc appreciation against
the euro to 7 percent during the first half of 2010, when the euro was falling against the U.S.
dollar by 13 percent, thereby preserving its export competiveness.
In a similar vein but using the quantity tool rather than the price tool, Thailand attempted to
curb the massive inflow of footloose capital, which had strengthened the Thai baht against the
U.S. dollar by 17 percent in 2006, undermining its export competitiveness. On December 19,
2006, the Bank of Thailand enacted a Tobin-style tax on all foreign investment (direct as well as
portfolio investment), which required foreign investors to make a 30 percent interest-free de-
posit with the Bank of Thailand for at least a year as collateral to any stock portfolio invest-
ment. Investors were spooked, and the Stock Exchange of Thailand dropped by 15 percent, wip-
ing out $22 billion of market capitalization. The tax applicable on stock investment was can-
celed the next day!
Controlled Exchange Rates
Expert Solution
This question has been solved!
Explore an expertly crafted, step-by-step solution for a thorough understanding of key concepts.
This is a popular solution
Trending nowThis is a popular solution!
Step by stepSolved in 4 steps with 4 images

Knowledge Booster
Learn more about
Need a deep-dive on the concept behind this application? Look no further. Learn more about this topic, finance and related others by exploring similar questions and additional content below.Similar questions
- A large bank is quoting the following spot exchange rates for number of YEN per USD, number of THB per USD and number of YEN per THB respectively. YEN/USD = 116.91 -- 116.95 THB/USD = 44.30 -- 44.40 YEN/THB = 2.6900 -- 2.7100. You are trader at Axe Capital, a US hedge fund, and your job is to try to find arbitrages in the currency markets. You have 10 mio USD risk capital provided by your fund. Using the 10 mio USD risk capital, how much arbitrage (guaranteed risk-free) profit can you make. If there is no arbitrage possible, enter zero. Give your answer in USD to the nearest USD. Please Do your calculation in excel and do not round anything until the very end.arrow_forwardOnly the third questionarrow_forwardNote:- Do not provide handwritten solution. Maintain accuracy and quality in your answer. Take care of plagiarism. Answer completely. You will get up vote for sure.arrow_forward
- Note:- Do not provide handwritten solution. Maintain accuracy and quality in your answer. Take care of plagiarism. Answer completely. You will get up vote for sure.arrow_forwardWhat is the likely frequency of the data (daily, monthly, yearly)? Compare to historical historical data in the picture to justify the answer.arrow_forwardFind the future value of the following annuities. The first payment in these annuities is made at the end of Year 1, so they are ordinary annuities. (Notes: If you are using a financial calculator, you can enter the known values and then press the appropriate key to find the unknown variable. Then, without clearing the TVM register, you can "override" the variable that changes by simply entering a new value for it and then pressing the key for the unknown variable to obtain the second answer. This procedure can be used in many situations, to see how changes in input variables affect the output variable. Also, note that you can leave values in the TVM register, switch to Begin Mode, press FV, and find the FV of the annuity due.) Do not round intermediate calculations. Round your answers to the nearest cent. $600 per year for 10 years at 10%. $ $300 per year for 5 years at 5%. $ $600 per year for 5 years at 0%. $ Now rework parts a, b, and c assuming that payments are made…arrow_forward
- ing annuities. The first payment in these annuities is made at the end of Year 1, so they are ordinary annuities. Do not round intermediate calculations. Round your answers to the nearest cent. (Notes: If you are using a financial calculator, you can enter the known values and then press the appropriate key to find the unknown variable. Then, without clearing the TVM register, you can "override" the variable that changes by simply entering new value for it and then pressing the key for the unknown variable to obtain the second answer. This procedure can be used in many situations, to see how changes in input variables affect the output variable. Also, note that you can leave values in the TVM register, switch to Begin Mode, press FV, and find the FV of the annuity due.) a. $600 per year for 10 years at 6%. $ b. $300 per year for 5 years at 3%. $ c. $600 per year for 5 years at 0%. $ d. Now rework parts a, b, and c assuming that payments are made at the beginning of each year; that is,…arrow_forwardSuppose that a commercial bank's current quote for transactions involving the United States dollar is A$1.3214 A$1.3298. (a) State the ask and bid prices for the bank. (b) Calculate the bid/ask spread for the bank.arrow_forwardIn 2018, the yen went from $0.00887619 to $0.00906626. • By how much did the yen appreciate against the dollar? • By how much has the dollar depreciated against the yen?arrow_forward
arrow_back_ios
arrow_forward_ios
Recommended textbooks for you
 Essentials Of InvestmentsFinanceISBN:9781260013924Author:Bodie, Zvi, Kane, Alex, MARCUS, Alan J.Publisher:Mcgraw-hill Education,

 Foundations Of FinanceFinanceISBN:9780134897264Author:KEOWN, Arthur J., Martin, John D., PETTY, J. WilliamPublisher:Pearson,
 Fundamentals of Financial Management (MindTap Cou...FinanceISBN:9781337395250Author:Eugene F. Brigham, Joel F. HoustonPublisher:Cengage Learning
 Corporate Finance (The Mcgraw-hill/Irwin Series i...FinanceISBN:9780077861759Author:Stephen A. Ross Franco Modigliani Professor of Financial Economics Professor, Randolph W Westerfield Robert R. Dockson Deans Chair in Bus. Admin., Jeffrey Jaffe, Bradford D Jordan ProfessorPublisher:McGraw-Hill Education

Essentials Of Investments
Finance
ISBN:9781260013924
Author:Bodie, Zvi, Kane, Alex, MARCUS, Alan J.
Publisher:Mcgraw-hill Education,


Foundations Of Finance
Finance
ISBN:9780134897264
Author:KEOWN, Arthur J., Martin, John D., PETTY, J. William
Publisher:Pearson,

Fundamentals of Financial Management (MindTap Cou...
Finance
ISBN:9781337395250
Author:Eugene F. Brigham, Joel F. Houston
Publisher:Cengage Learning

Corporate Finance (The Mcgraw-hill/Irwin Series i...
Finance
ISBN:9780077861759
Author:Stephen A. Ross Franco Modigliani Professor of Financial Economics Professor, Randolph W Westerfield Robert R. Dockson Deans Chair in Bus. Admin., Jeffrey Jaffe, Bradford D Jordan Professor
Publisher:McGraw-Hill Education