Calculating Incidence versus Prevalence
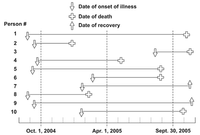
The picture represents 10 new cases of illness over about 15 months in a population of 20 persons. Each horizontal line represents one person. The down arrow indicates the date of onset of illness. The solid line represents the duration of illness. The up arrow and the cross represent the date of recovery and date of death, respectively.
The picture New: Cases of Illness from October 1, 2004–September 30, 2005
Question: Calculate the point prevalence on April 1, 2005. Point prevalence is the number of persons ill on the date divided by the population on that date. On April 1, seven persons (persons 1, 4, 5, 7, 9, and 10) were ill.

Trending nowThis is a popular solution!
Step by stepSolved in 2 steps with 1 images

- For each vignette, choose the type of research that is being conducted. There is only one correct answer for each vignette. Here are your answer choices for questions 1-18 Case Study Naturalistic Observation Laboratory Observation Survey Correlation Test Experiment Longitudinal Design Cross Section Cross Sequential Design Maria wants to understand the political demographics in her community, so she creates a questionnaire asking people to identify their age, gender, political affiliation, religion and marital status. After Maria collects the abovementioned data (in question #12), she then identifies the relationships between religion and political affiliation. Kathi…arrow_forwardConsider the women's 100-yd dash (and the subsequent 100-m dash) in the Olympics since records have been kept. Determine the best way to combine all data and depict the data. Choose the correct answer below. O A. A line graph would be the best way to show all of the data over time, but some measurements would have to be converted to display the 100-yd and 100-m on the same graph. OB. A scatterplot would show the relationship between the 100-yd dash and the 100-m dash. O C. A stem and leaf plot would be the best way to show all of the data grouped by race times. O D. A histogram would show all of the data by comparing each year. The units of distance would not matter. Click to select your answer. 2:50 PM P Type here to search 3/10/202 Prt Scn End F10 PgUp Home F7 DII B F5 F6arrow_forwardFor each type of chart determine the type of variable that should be usedarrow_forward
 MATLAB: An Introduction with ApplicationsStatisticsISBN:9781119256830Author:Amos GilatPublisher:John Wiley & Sons Inc
 Probability and Statistics for Engineering and th...StatisticsISBN:9781305251809Author:Jay L. DevorePublisher:Cengage Learning
 Statistics for The Behavioral Sciences (MindTap C...StatisticsISBN:9781305504912Author:Frederick J Gravetter, Larry B. WallnauPublisher:Cengage Learning
 Elementary Statistics: Picturing the World (7th E...StatisticsISBN:9780134683416Author:Ron Larson, Betsy FarberPublisher:PEARSON
 The Basic Practice of StatisticsStatisticsISBN:9781319042578Author:David S. Moore, William I. Notz, Michael A. FlignerPublisher:W. H. Freeman
 Introduction to the Practice of StatisticsStatisticsISBN:9781319013387Author:David S. Moore, George P. McCabe, Bruce A. CraigPublisher:W. H. Freeman


