
Chemistry
10th Edition
ISBN: 9781305957404
Author: Steven S. Zumdahl, Susan A. Zumdahl, Donald J. DeCoste
Publisher: Cengage Learning
expand_more
expand_more
format_list_bulleted
Related questions
Question
Calculate the number average molecular weight corresponding to the molecular weight distribution for the synthetic polymer sample fractionated in the graph below if the polydispersity index is 1.25
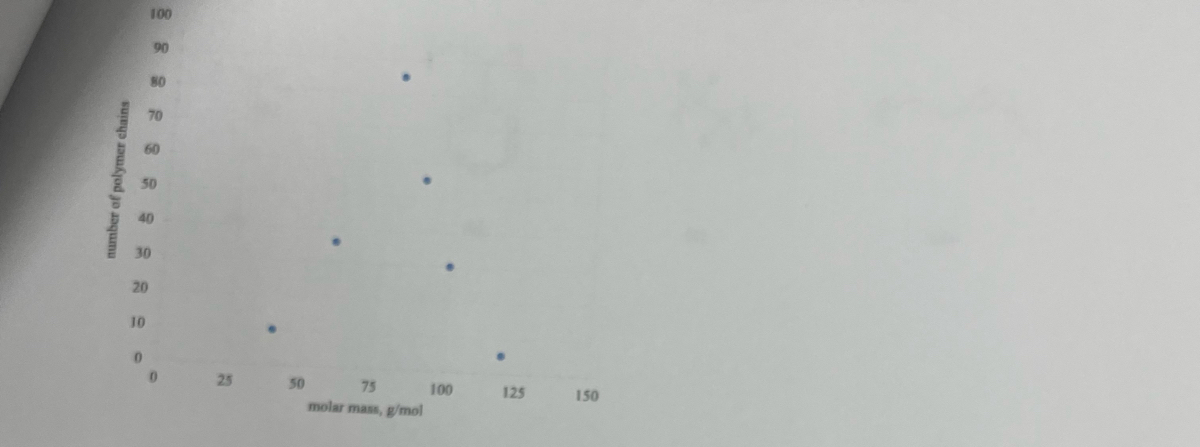

Transcribed Image Text:The image features a scatter plot graph depicting the relationship between molar mass (in grams per mole, g/mol) and the number of polymer chains.
**Axes Description:**
- **X-Axis:** Represents the molar mass, ranging from 0 to 150 g/mol with clear intervals at 25, 50, 75, 100, and 125 g/mol.
- **Y-Axis:** Represents the number of polymer chains, ranging from 0 to 100 with intervals of 10 (e.g., 0, 10, 20, up to 100).
**Data Points:**
The scatter plot contains several data points distributed across the graph:
- At approximately 30 g/mol with about 10 polymer chains.
- Around 50 g/mol with about 20 polymer chains.
- Near 75 g/mol with approximately 40 polymer chains.
- At 90 g/mol with roughly 50 polymer chains.
- At about 105 g/mol with approximately 80 polymer chains.
**Interpretation:**
This scatter plot suggests a potential correlation between the molar mass of a substance and the number of polymer chains. As the molar mass increases, the number of polymer chains tends to increase as well. This could indicate how different molar masses result in varying sizes or amounts of polymer chains, possibly related to their physical or chemical properties.
Expert Solution
This question has been solved!
Explore an expertly crafted, step-by-step solution for a thorough understanding of key concepts.

Step by stepSolved in 3 steps with 2 images

Knowledge Booster


Learn more about
Need a deep-dive on the concept behind this application? Look no further. Learn more about this topic, chemistry and related others by exploring similar questions and additional content below.Similar questions
- . These resins are organic polymeric networks that contain functional groups that are permanently attached to the resin. One such functional group is sulfonic acid, -SO3H. When placed in water, the resin (being a large organic molecule) will not dissolve. However, the ionic functional groups become hydrated and the resin will swell as it takes up waters of hydration. The resin may then be thought of as a solid solution mixture with the functional groups being "dissolved" but the polymer remaining as a solid. The hydronium ion (H3O+) associated with acidic functional groups like sulfonic acid will dissociate just as it would if the acid were free of the resin. If other cations such as Cu2+ or Na+ are added to the resin, an ion-exchange reaction can occur: . Note that one H+ is released for each positive charge bound to the resin. Since the resin exchanges a hydrogen ion for a sodium ion in this reaction, sulfonic acid resins are called cation-exchange resins. Equilibrium constants may…arrow_forwardHow does the rate of temperature elevation influence the results of the melting point determination?arrow_forwardwith the For a poly(hexamethylen-adipamide) polymerization degree of 200, write the structure and compute the exact and approximate molecular mass.arrow_forward
arrow_back_ios
arrow_forward_ios
Recommended textbooks for you
- ChemistryChemistryISBN:9781305957404Author:Steven S. Zumdahl, Susan A. Zumdahl, Donald J. DeCostePublisher:Cengage Learning
 ChemistryChemistryISBN:9781259911156Author:Raymond Chang Dr., Jason Overby ProfessorPublisher:McGraw-Hill Education
 Principles of Instrumental AnalysisChemistryISBN:9781305577213Author:Douglas A. Skoog, F. James Holler, Stanley R. CrouchPublisher:Cengage Learning
  Organic ChemistryChemistryISBN:9780078021558Author:Janice Gorzynski Smith Dr.Publisher:McGraw-Hill Education
 Chemistry: Principles and ReactionsChemistryISBN:9781305079373Author:William L. Masterton, Cecile N. HurleyPublisher:Cengage Learning
 Elementary Principles of Chemical Processes, Bind...ChemistryISBN:9781118431221Author:Richard M. Felder, Ronald W. Rousseau, Lisa G. BullardPublisher:WILEY
Chemistry
Chemistry
ISBN:9781305957404
Author:Steven S. Zumdahl, Susan A. Zumdahl, Donald J. DeCoste
Publisher:Cengage Learning
Chemistry
Chemistry
ISBN:9781259911156
Author:Raymond Chang Dr., Jason Overby Professor
Publisher:McGraw-Hill Education
Principles of Instrumental Analysis
Chemistry
ISBN:9781305577213
Author:Douglas A. Skoog, F. James Holler, Stanley R. Crouch
Publisher:Cengage Learning
Organic Chemistry
Chemistry
ISBN:9780078021558
Author:Janice Gorzynski Smith Dr.
Publisher:McGraw-Hill Education
Chemistry: Principles and Reactions
Chemistry
ISBN:9781305079373
Author:William L. Masterton, Cecile N. Hurley
Publisher:Cengage Learning
Elementary Principles of Chemical Processes, Bind...
Chemistry
ISBN:9781118431221
Author:Richard M. Felder, Ronald W. Rousseau, Lisa G. Bullard
Publisher:WILEY