
FINANCIAL ACCOUNTING
10th Edition
ISBN: 9781259964947
Author: Libby
Publisher: MCG
expand_more
expand_more
format_list_bulleted
Related questions
Question
- Calculate
ROI for 2017. - Calculate ROE for 2017.
- Calculate
working capital at July 30, 2017, and July 31, 2016. - Calculate
current ratio at July 30, 2017, and July 31, 2016. - Calculate Acid-test ratio at July 30, 2017, and July 31, 2016.
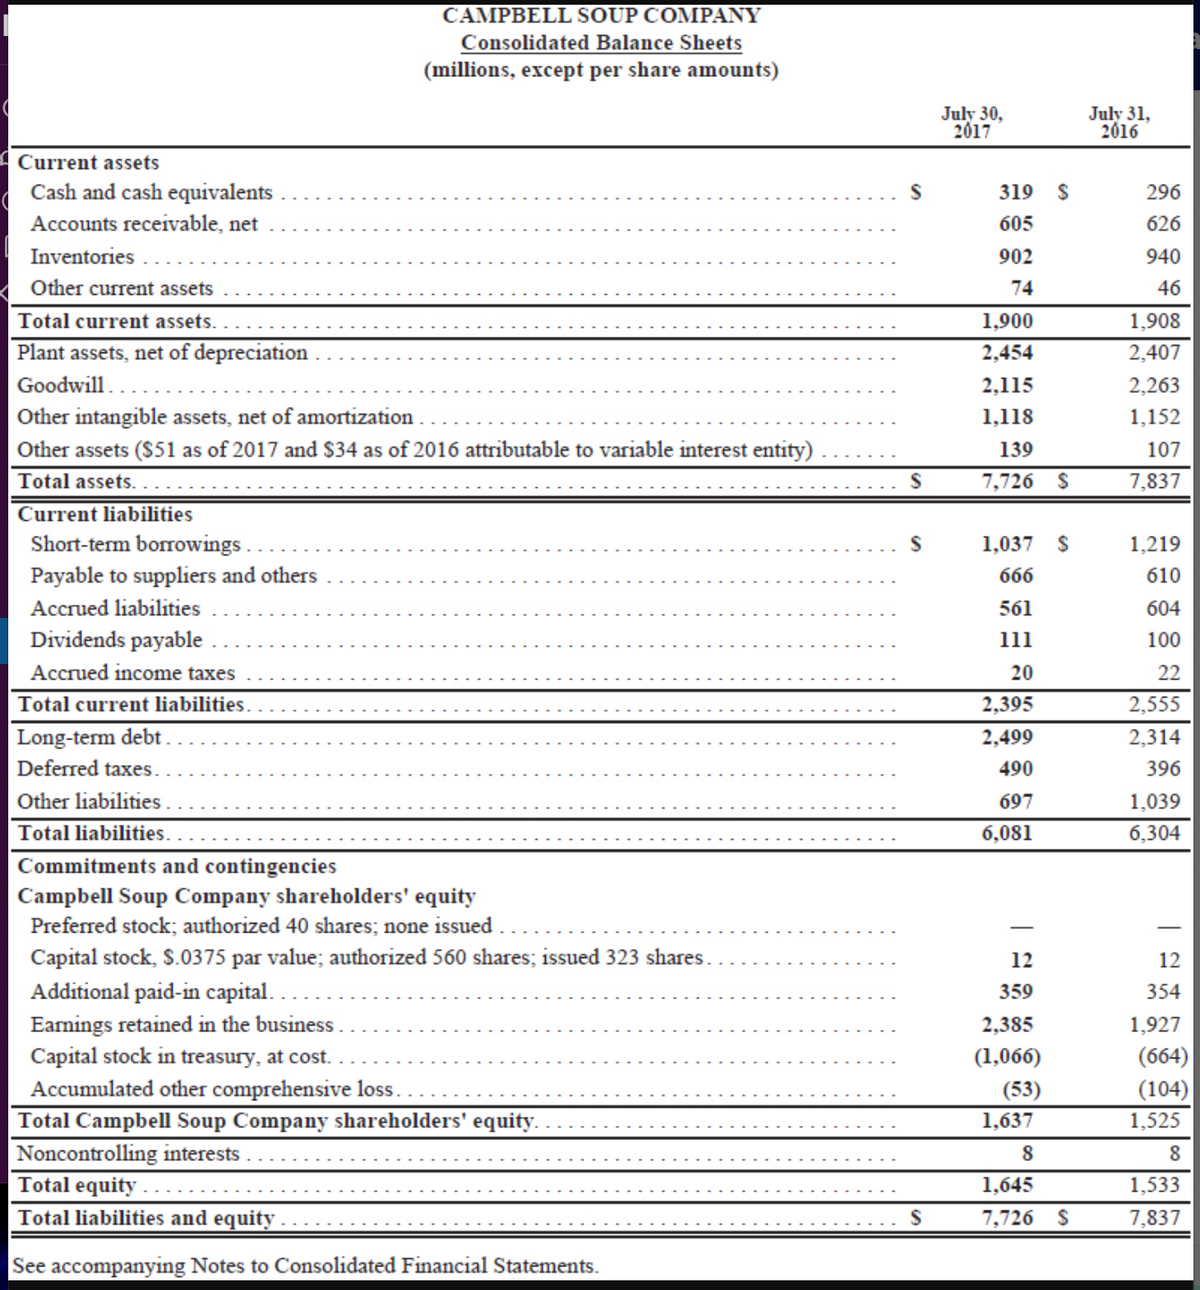

Transcribed Image Text:CAMPBELL SOUP COMPANY
Consolidated Balance Sheets
(millions, except per share amounts)
July 30,
2017
July 31,
2016
- Current assets
Cash and cash equivalents
319
296
Accounts receivable, net
605
626
Inventories
902
940
Other current assets
74
46
Total current assets.
1,900
1,908
Plant assets, net of depreciation
2,454
2,407
Goodwill.
2,115
2,263
Other intangible assets, net of amortization
1,118
1,152
Other assets ($51 as of 2017 and $34 as of 2016 attributable to variable interest entity)
Total assets. .
Current liabilities
Short-term borrowings...
Payable to suppliers and others
139
107
7,726 S
7,837
1,037 S
1,219
666
610
Accrued liabilities
561
604
Dividends payable
111
100
Accrued income taxes
20
22
Total current liabilities.
2,395
2,555
Long-term debt.
Deferred taxes.
2,499
2,314
490
396
Other liabilities.
Total liabilities. .
Commitments and contingencies
697
1,039
6,081
6,304
Campbell Soup Company shareholders' equity
Preferred stock; authorized 40 shares; none issued .
Capital stock, S.0375 par value; authorized 560 shares; issued 323 shares.
12
12
Additional paid-in capital. .
359
354
Earnings retained in the business.
Capital stock in treasury,
2,385
1,927
(1,066)
(664)
Accumulated other comprehensive loss..
(53)
(104)
Total Campbell Soup Company shareholders' equity.
1,637
1,525
Noncontrolling interests .
Total equity
Total liabilities and equity
8
8
1,645
1,533
7,726
7,837
See accompanying Notes to Consolidated Financial Statements.

Transcribed Image Text:Financial Highlights
(dollars in millions, except per share amounts)
2017
2016
=782
SY4
Results of Operations
Net Sales
24
7,890
24
7,961
Gross Profit
%24
24
2,780
3,059
38.8%
%24
Percent of Sales
34.9%
Earnings before interest and taxes
Net earnings attributable to Campbell Soup Company
Per share – diluted
24
2$
24
1,400
960
24
%24
887
563
2.89
1.81
Other Information
1,491
24
1.248
24
2$
Net cash provided by operating activities
Capital expenditures
Dividends per share
1,291
%24
24
338
341
1.40
24
In 2017, Net earnings attributable to Campbell Soup Company included the following: a restructuring charge, related costs and administrative expenses of
$37 ($0.12 per share) associated with restructuring and cost savings initiatives; gains of $116 ($0.38 per share) associated with mark-to-market adjustments for
defined benefit pension and postretirement plans; impairment charges of $180 ($0.59 per share) related to the intangible assets of the Bolthouse Farms carrot
and carrot ingredients reporting unit and the Garden Fresh Gourmet reporting unit; and a tax benefit and reduction to interest expense of $56 ($0.18 per
share) primarily associated with the sale of intercompany notes receivable to a financial institution.
WEBL
upd
In 2016, Net earnings attributable to Campbell Soup Company included the following: a restructuring charge and administrative expenses of $49 ($0.16 per
share) associated with restructuring and cost savings initiatives; losses of $200 ($0.64 per share) associated with mark-to-market adjustments for defined
benefit pension and postretirement plans; an impairment charge of $127 ($0.41 per share) related to the intangible assets of the Bolthouse Farms carrot and
carrot ingredients reporting unit; and a gain of $25 ($0.08 per share) associated with a settlement of a claim related to the Kelsen acquisition.
See below for a reconciliation of the impact of these items on reported results.
Reconciliation of GAAP and Non-GAAP Financial Measures
en R
-12.
The following information is provided to reconcile certain non-GAAP financial measures disclosed in the Letter to Shareholders to reported sales and earnings
results. These non-GAAP financial measures are measures of performance not defined by accounting principles generally accepted in the United States and
should be considered in addition to, not in lieu of, GAAP reported measures. We believe that presenting certain non-GAAP financial measures facilitates
comparison of our historical operating results and trends in our underlying operating results, and provides transparency on how we evaluate our business. For
instance, we believe that organic net sales, which exclude the impact of currency, are a better indicator of our ongoing business performance. We also believe
that the financial information excluding certain transactions not considered to be part of the ongoing business improves the comparability of year-to-year earnings
results. Consequently, we believe that investors may be able to better understand our earnings results if these transactions are excluded from the results.
Recc
(dollars in millions)
2017
2016
% Change
...PI
Net Sales
$ 7,890
$7,961
-1%
Volume and Mix
-1%
Price and Sales Allowances
0%
Promotional Spending
-1%
Organic Growth
-1%
Currency
0%
otal
-1%
prdi
M.m
The sum of the individual amounts does not add due to rounding.
2017
2016
Earnings % Change EPS % Change
Earnings
Impact
Diluted
EPS
Impact
Earnings
Impact
Diluted
EPS
Impact
2017/2016
(dollars in millions, except per share amounts)
Net earnings attributable to
Campbell Soup Company, as reported
Restructuring charges, implementation costs
2017/2016
-cor
$ 887
$ 2.89
$563
$1.81
РМ.
and other related costs
37
0.12
49
0.16
Pension and postretirement benefit
mark-to-market adjustments
(116)
(0.38)
200
0.64
Impairment charges
180
0.59
127
0.41
Sale of notes
(56)
(0.18)
Claim settlement
(25)
(0.08)
Report Adjusted Net earnings attributable
to Campbell Soup Company
$ 932
$ 3.04
$914
$2.94
2%
3%
Expert Solution
This question has been solved!
Explore an expertly crafted, step-by-step solution for a thorough understanding of key concepts.

This is a popular solution

Trending nowThis is a popular solution!

Step by stepSolved in 4 steps

Knowledge Booster

Similar questions
- Projecting NOPAT and NOA Using Parsimonious Forecasting Method Following are Logitech's sales, net operating profit after tax (NOPAT), and net operating assets (NOA) for its fiscal year ended March 31, 2019 ($ thousands). Note: Complete the entire question using the following Excel template: Excel Template. Then enter the answers into the provided spaces below with two decimal places. Financial information Net sales Net operating profit after tax (NOPAT) Net operating assets (NOA) $2,091,242 158,522 428,867 Use the parsimonious method to forecast Logitech's sales, NOPAT, and NOA for fiscal years ended March 31, 2020 through 2023 using the following assumptions. Note: Complete the entire question in Excel (template provided above). Using Excel, format each answer to two decimal places. Use Increase Decimal or Decrease Decimal to adjust decimal places. Do not round answers. Then enter the answers into the provided spaces below with two decimal places_. Note: When completing the question…arrow_forwardWith a given information below: (A) Prepare Income Statement and Balance Sheet in the Year 2020. (B) Analyze Income Statement and Balance Sheet in the Year 2020 Vertically. (C) Compute Financial Ratios: (1) ROE, (2) ROA, (3) Average Collection Period, (4) Debt to Asset, (5) Debt to Equity, (6) Time Interest Earned, (7) Total Assets Turnover, (8) Operating Profit Margin, (9) Return On Common Equity (ROCE), (10) Net Working Capital Ratio, (11) Quick Ratio, (12) Current Ratio. Cash $6,000 Sales $100,000 Utility Expense $8,000 Buildings $65,000 Common Stock $45,000 Accounts Payable $12,000 Supplies $4,000 Cost of Goods Sold $58,000 Interest Expense $5,000 Additional Paid in Capital $20,000 Bonds Payable $40,000 Supplies Expense $3,000 Salaries Expense $16,000 Accounts Receivable $10,000 Inventories $45,000 Retained Earnings $5,000 (beg. bal.) Income Tax Rate 20%arrow_forwardThe image uploaded is the calculation of Societe Generale Profitability ratios, shorter liquidity ratios, long-term liquidity ratios, and investment ratios for 2020, 2021, 2022. A base year of 2019 was also added. Evaluate the financial performance by comparing the three (3) years' financial performance that is 2020, 2021, and 2022 I have provided in the table with the base year.arrow_forward
- Costco Financial Analysis. Perform the following ratio analysis for 2021, 2022, and 2023 for Costco using the attached financial statements. a. Profitability ratios b. Liquidity ratios c. Leverage ratios d. Activity ratios e. Price to earnings ratioarrow_forwardIn cell D22, by using cell references, calculate the total long-term assets for year 2014 Use the relevant cells from the given data in the balance sheet. In call D23, by using a cell reference, calculate the total assets for year 2014. Refer to the relevant cell from the given data in the balance sheet. Note: The total assets must equal the total liabilities and owners' equity." in cell D18, by using cell references, calculate the total current assets for year 2014. Use the relevant cells in the balance sheet. In cell D16, by using cell references, calculate the accounts receivable for year 2014. Use the relevant cells in the balance sheet, in cell H14, by using cell references, calculate the accounts payable for year 2014. Use the relevant cells from the given cata in the balance sheet. In cell H22, by using cell references, calculate the total owners' equity for year 2014. Use the relevant cells from the given data in the balance sheet. In cell H18, by using cell references,…arrow_forwardAccounting Questionarrow_forward
- i, j and karrow_forwardShow Attempt History Current Attempt in Progress Blossom Ltd. purchased a new machine on April 4, 2017, at a cost of $156,000. The company estimated that the machine would have a residual value of $14,000. The machine is expected to be used for 10,000 working hours during its four-year life. Actual machine usage was 1,600 hours in 2017; 2,400 hours in 2018; 2,200 hours in 2019; 2,100 hours in 2020; and 1,700 hours in 2021. Blossom has a December 31 year end. (a) pe here to search Your answer is partially correct. Calculate depreciation for the machine under each of the following methods: (Round expense per unit to 2 decimal places, e.g. 2.75 and final answers to 0 decimal places, e.g. 5,275.) (1) Straight-line for 2017 through to 2021. I 1139 Rain to stop Elarrow_forwardGuinea C. Company is preparing trend percentages for its service fees earned for the period 2013 through 2017. The base year is 2013. The 2016 trend percentage is computed as: Question 23 options: A) 2016 service fees earned divided by 2012 service fees earned B) 2015 service fees earned divided by 2016 service fees earned C) 2016 service fees earned divided by 2013 service fees earned D) 2013 service fees earned divided by 2016 service fees earnedarrow_forward
- Using the findings, provide a brief summary about the financial status of each of the companies and provide a recommendation for the investment choice.arrow_forwardplease show excel formulasarrow_forwardCalculate the Rate of Return on Assets (ROA) for 2011. Disaggregate ROA into the profit margin for ROA and total assets turnover components. Calculate the Rate of Return on Common Stockholders’ Equity (ROCE) for 2011. Disaggregate ROCE into the profit margin for ROCE, total assets turnover and capital structure leverage components.arrow_forward
arrow_back_ios
SEE MORE QUESTIONS
arrow_forward_ios
Recommended textbooks for you
 AccountingAccountingISBN:9781337272094Author:WARREN, Carl S., Reeve, James M., Duchac, Jonathan E.Publisher:Cengage Learning,
 Accounting Information SystemsAccountingISBN:9781337619202Author:Hall, James A.Publisher:Cengage Learning,
 Horngren's Cost Accounting: A Managerial Emphasis...AccountingISBN:9780134475585Author:Srikant M. Datar, Madhav V. RajanPublisher:PEARSON
 Intermediate AccountingAccountingISBN:9781259722660Author:J. David Spiceland, Mark W. Nelson, Wayne M ThomasPublisher:McGraw-Hill Education
 Financial and Managerial AccountingAccountingISBN:9781259726705Author:John J Wild, Ken W. Shaw, Barbara Chiappetta Fundamental Accounting PrinciplesPublisher:McGraw-Hill Education
Accounting
Accounting
ISBN:9781337272094
Author:WARREN, Carl S., Reeve, James M., Duchac, Jonathan E.
Publisher:Cengage Learning,
Accounting Information Systems
Accounting
ISBN:9781337619202
Author:Hall, James A.
Publisher:Cengage Learning,
Horngren's Cost Accounting: A Managerial Emphasis...
Accounting
ISBN:9780134475585
Author:Srikant M. Datar, Madhav V. Rajan
Publisher:PEARSON
Intermediate Accounting
Accounting
ISBN:9781259722660
Author:J. David Spiceland, Mark W. Nelson, Wayne M Thomas
Publisher:McGraw-Hill Education
Financial and Managerial Accounting
Accounting
ISBN:9781259726705
Author:John J Wild, Ken W. Shaw, Barbara Chiappetta Fundamental Accounting Principles
Publisher:McGraw-Hill Education