MATLAB: An Introduction with Applications
6th Edition
ISBN: 9781119256830
Author: Amos Gilat
Publisher: John Wiley & Sons Inc
expand_more
expand_more
format_list_bulleted
Concept explainers
Topic Video
Question
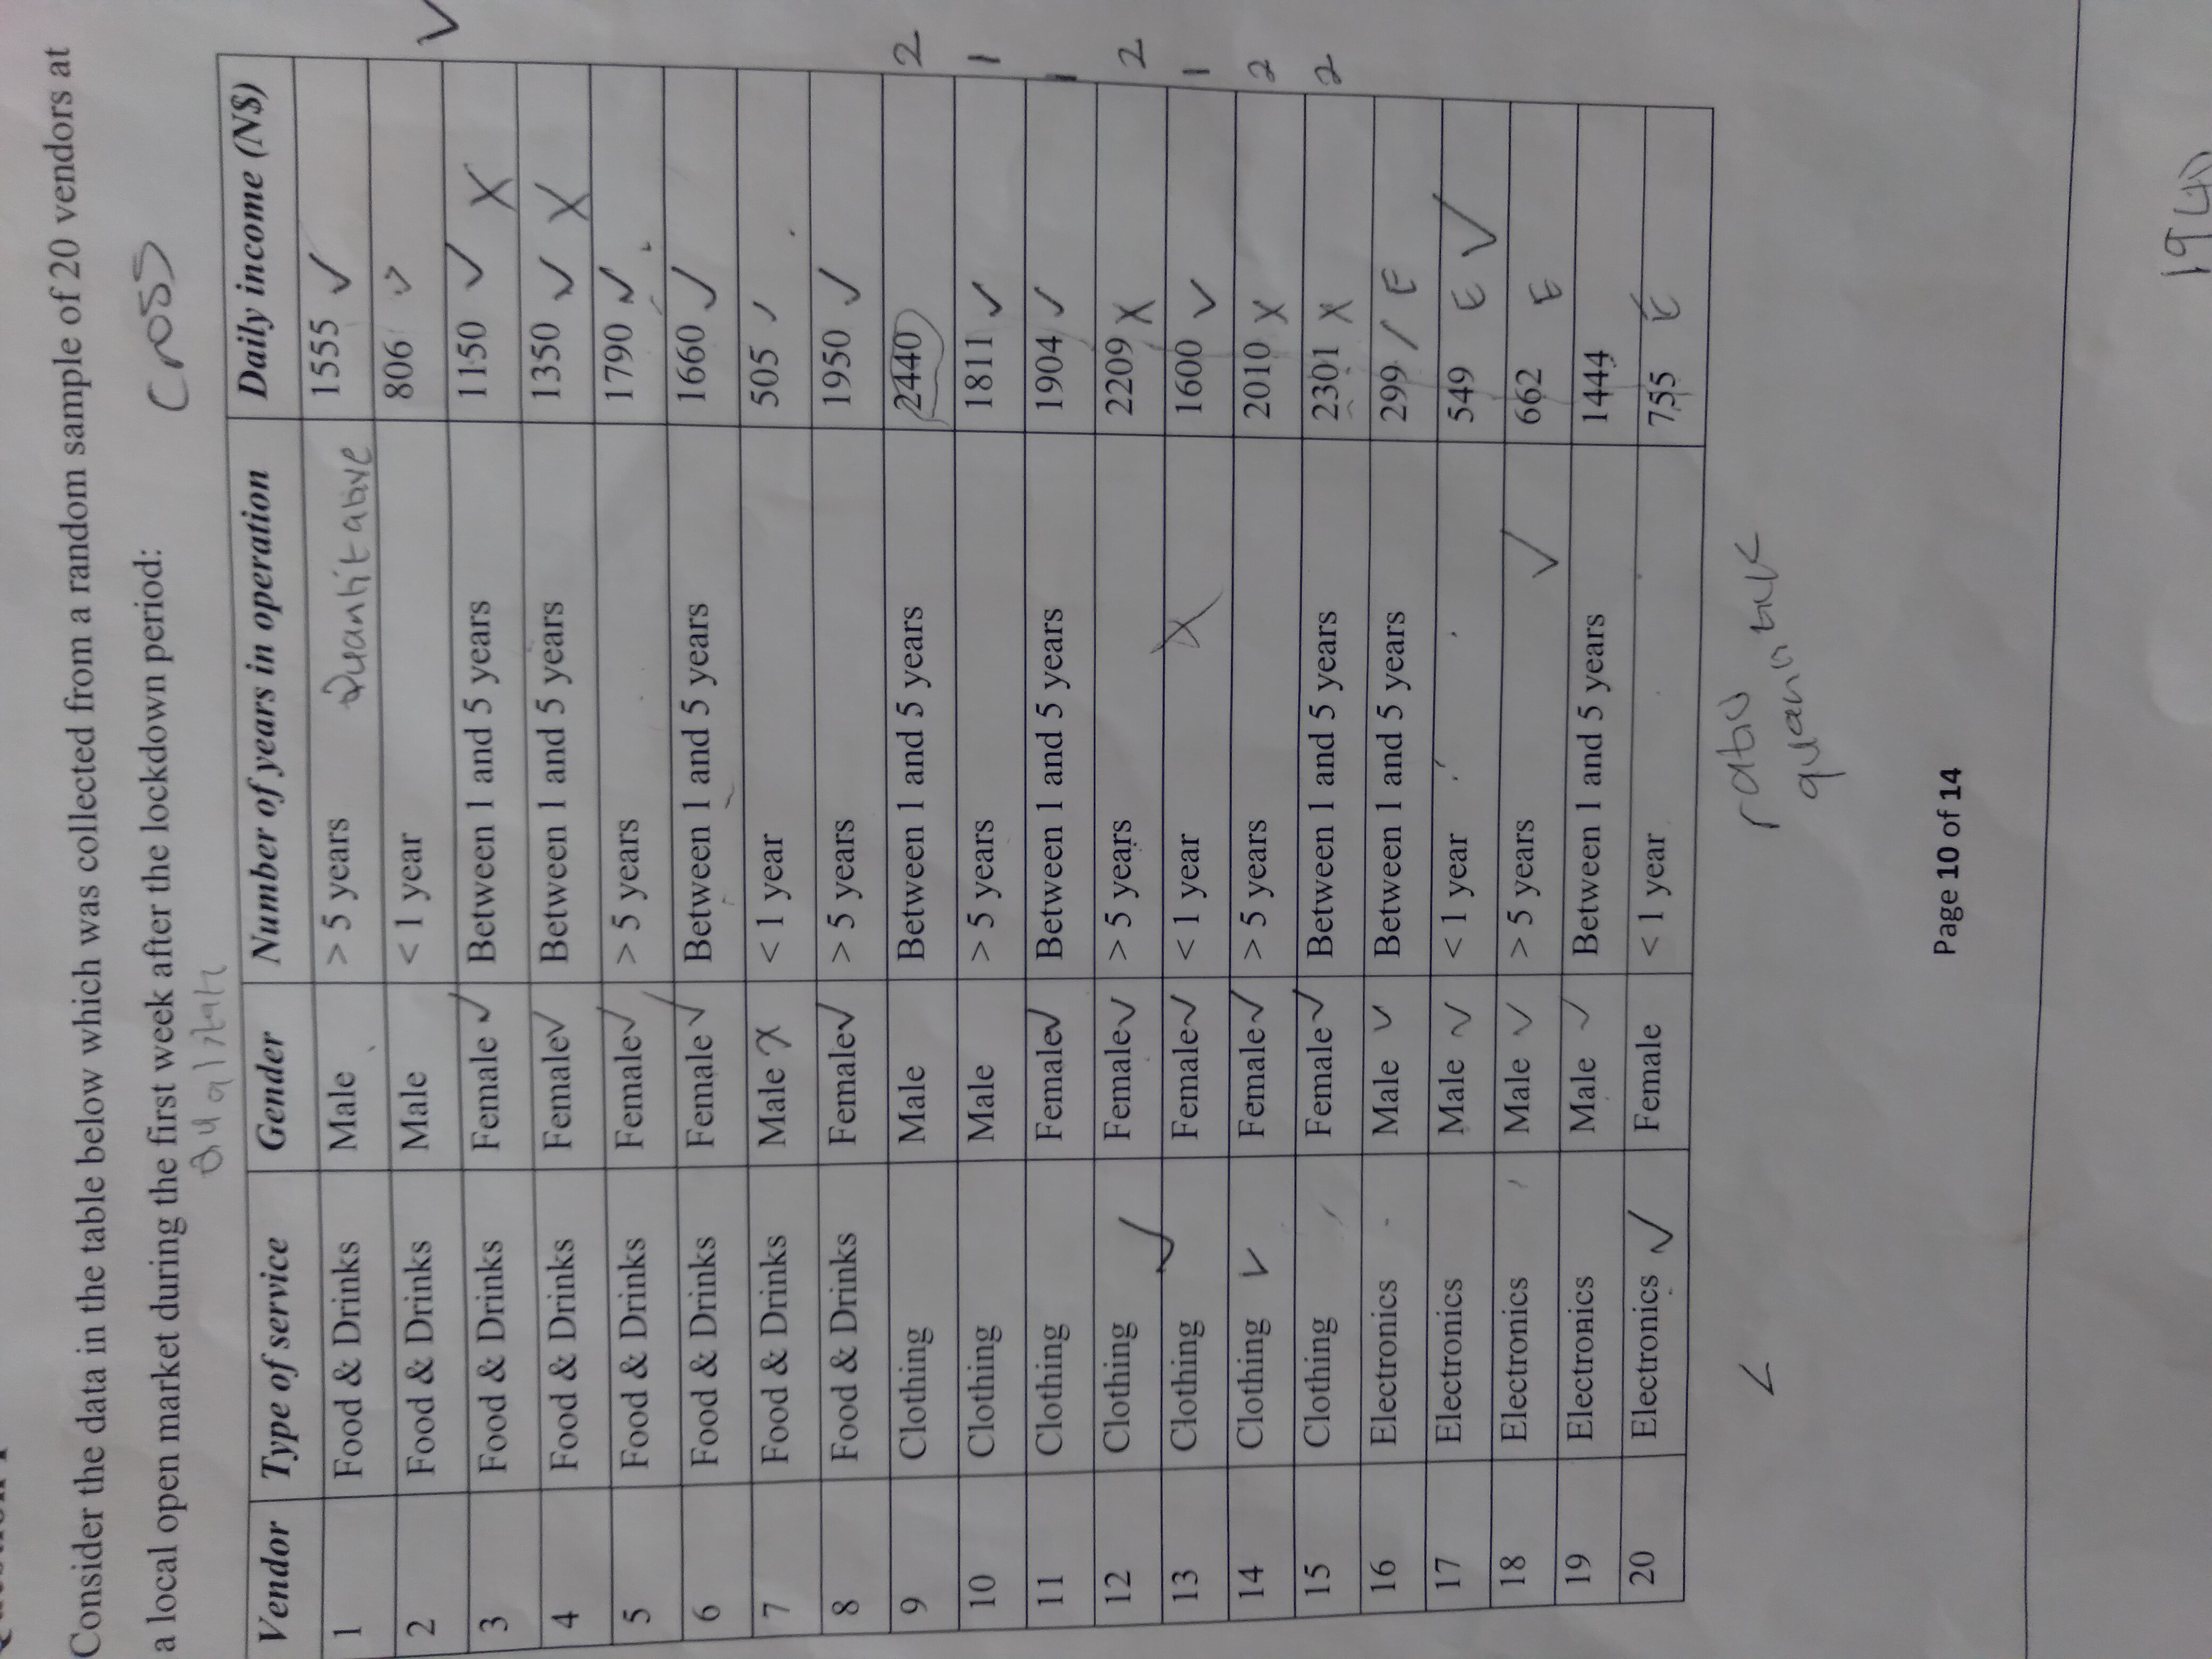
Calculate and interpret relative measures of variability for the Daily Income for each of the three categories of Type of service.

Expert Solution
This question has been solved!
Explore an expertly crafted, step-by-step solution for a thorough understanding of key concepts.
Step by stepSolved in 4 steps

Knowledge Booster
Learn more about
Need a deep-dive on the concept behind this application? Look no further. Learn more about this topic, statistics and related others by exploring similar questions and additional content below.Similar questions
- Define the term Independent Variable?arrow_forwardThis data type data is non-numbers, OR numbers that do not represent quantities.arrow_forwardRail ridership during the summer months in the North-East is believed to beclosely related to the number of tourists visiting the region. The following tableshows the data on the number of tourists and North-East ridership for the past16 years.Year Tourists( in millions) Rail Ridership (in millions) 2000 9 2.32001 4 1.9 2002 7 1.7 2003 5 1.8 2004 12 2.8 2005 13 2.9 2006 14 2.42007 20 4.8 2008 7 1.3 2009 5 1.12010 9…arrow_forward
- 3. Describe why data description using graphical methods sometimes is not sufficient b. measures of central tendency sometimes missleadarrow_forwardName all of the following data sets that you would expect to be skewed. I. waiting times at the bankII. salaries of teachersIII. the selling price of homes IV. fuel efficiency of compact cars II and III IandII I, II, and III IVarrow_forwardExplain what a box and whisker plot is and how we use it to understand central tendency and variability.arrow_forward
- Each year forbes ranks the world’s most valuable brands. A portion of the data for 82 ofthe brands in the 2013 forbes list is shown in Table 2.12 (forbes website, february, 2014).The data set includes the following variables:brand: The name of the brand.Industry: The type of industry associated with the brand, labeled Automotive& Luxury, Consumer Packaged Goods, financial Services, Other, Technology.brand Value ($ billions): A measure of the brand’s value in billions of dollarsdeveloped by forbes based on a variety of financial information about the brand.1-Yr Value Change (%): The percentage change in the value of the brand over theprevious year.brand Revenue ($ billions): The total revenue in billions of dollars for the brand.a. Prepare a crosstabulation of the data on Industry (rows) and brand Value ($ billions).Use classes of 0–10, 10–20, 20–30, 30–40, 40–50, and 50–60 for brand Value($ billions).b. Prepare a frequency distribution for the data on Industry.arrow_forwardDefine the term Qualitative variable with example?arrow_forwardWhich set of variables has correlation and causation? A. distance traveled and money spent on gas B. distance traveled and money spent on snacks C. distance traveled and number of drinks consumed D. distance traveled and time spent listening to musicarrow_forward
- True or false. When drawing a scatter diagram, the explanatory variable is placed along the vertical axis.arrow_forwardIs the following nominal, ordinal, or interval data? Explain your answer. Stock pricesarrow_forwardThe trend of thinner beauty pageant winners has generated charges that the contest encourages unhealthy diet habits among young women. Listed below are body mass indexes (BMI) for beauty pageant winners from two different time periods. Find the coefficient of variation for each of the two sets of data, then compare the variation. The coefficient of variation for the BMI's of beauty pageant winners from the 1920s and 1930s is %arrow_forward
arrow_back_ios
SEE MORE QUESTIONS
arrow_forward_ios
Recommended textbooks for you
 MATLAB: An Introduction with ApplicationsStatisticsISBN:9781119256830Author:Amos GilatPublisher:John Wiley & Sons Inc
 Probability and Statistics for Engineering and th...StatisticsISBN:9781305251809Author:Jay L. DevorePublisher:Cengage Learning
 Statistics for The Behavioral Sciences (MindTap C...StatisticsISBN:9781305504912Author:Frederick J Gravetter, Larry B. WallnauPublisher:Cengage Learning
 Elementary Statistics: Picturing the World (7th E...StatisticsISBN:9780134683416Author:Ron Larson, Betsy FarberPublisher:PEARSON
 The Basic Practice of StatisticsStatisticsISBN:9781319042578Author:David S. Moore, William I. Notz, Michael A. FlignerPublisher:W. H. Freeman
 Introduction to the Practice of StatisticsStatisticsISBN:9781319013387Author:David S. Moore, George P. McCabe, Bruce A. CraigPublisher:W. H. Freeman

MATLAB: An Introduction with Applications
Statistics
ISBN:9781119256830
Author:Amos Gilat
Publisher:John Wiley & Sons Inc

Probability and Statistics for Engineering and th...
Statistics
ISBN:9781305251809
Author:Jay L. Devore
Publisher:Cengage Learning

Statistics for The Behavioral Sciences (MindTap C...
Statistics
ISBN:9781305504912
Author:Frederick J Gravetter, Larry B. Wallnau
Publisher:Cengage Learning

Elementary Statistics: Picturing the World (7th E...
Statistics
ISBN:9780134683416
Author:Ron Larson, Betsy Farber
Publisher:PEARSON

The Basic Practice of Statistics
Statistics
ISBN:9781319042578
Author:David S. Moore, William I. Notz, Michael A. Fligner
Publisher:W. H. Freeman

Introduction to the Practice of Statistics
Statistics
ISBN:9781319013387
Author:David S. Moore, George P. McCabe, Bruce A. Craig
Publisher:W. H. Freeman