Advanced Engineering Mathematics
10th Edition
ISBN: 9780470458365
Author: Erwin Kreyszig
Publisher: Wiley, John & Sons, Incorporated
expand_more
expand_more
format_list_bulleted
Question
thumb_up100%

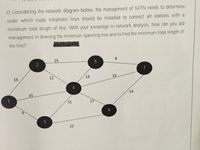
Transcribed Image Text:c) Considering the network diagram below, the management of MTN needs to determine
under which roads telephone lines should be installed to connect all stations with a
minimum total length of line. With your knowlege in network analysis, how can you aid
management in drawing the minimum spanning tree and to find the minimum total length of
the line?
Arbyo CasaPo
25
8
5
7
12
14
19
16
4
14
35
15
17
3
22
2.
6.
Expert Solution
This question has been solved!
Explore an expertly crafted, step-by-step solution for a thorough understanding of key concepts.
Step by stepSolved in 2 steps with 2 images

Knowledge Booster
Similar questions
- The first step in formulating an LP problem is A graph the problem. construct the objective and the constraints. O perform a sensitivity analysis. understand the managerial problem being faced.arrow_forwardA pipeline network will be built that will connect six cities. Costs (in hundreds million dollars) to build these pipelines depending on the distance shown by the weighted graph below. Find a pipeline system for connecting all cities but with minimal total cost.arrow_forwardBelow is the graph showing the number of viewers for different. movies at Cineplex Theatre. What is the difference between the highest and the lowest number of viewers? Number of Viewers 350 300 250 200 150 100 so D Movie a) 200 b) 100 c) 400 d) 10arrow_forward
- Suppose that in solving a TSP you use the nearest-neighboralgorithm and find a nearest-neighbor tour with a total costof $13,500. Suppose that you later find out that the cost ofan optimal tour is $12,000. What was the relative error ofyour nearest-neighbor tour? Express your answer as a percentage,rounded to the nearest tenth of a percent.arrow_forwardOtitis media, or middle ear infection, is initially treated with an antibiotic. Researchers have compared two antibiotics, A and B, for their cost effectiveness. A is inexpensive, safe, and effective. B is also safe. However, it is considerably more expensive and it is generally more effective. Use the tree diagram to the right (where the costs are estimated as the total cost of medication, office visit, ear check, and hours of lost work) to answer the following. a. Find the expected cost of using each antibiotic to treat a middle ear infection. b. To minimize the total expected cost, which antibiotic should be chosen? a. The expected cost of using antibiotic A is S (Round to the nearest cent as needed.) D w an example Get more help ww O Search e ( *** O 19 'C Clear all 0.70 Cure $59.30 A 0.30 No cure $96.15 0.85, Care $69.15 B 0.15 No cure $106.00 Check answer 2:17 PM 12/15/2022arrow_forwarda) Which learning approach will fit here better? Explainb) Draw a learning graph using your own data split.c) Describe Overfitting and Underfitting using your learning graph.d) Randomly split the given data in train and test set and explain your splittinge) Does your model Overfit or Underfit? How you will remove it. Justify your answer.arrow_forward
- help B and Carrow_forwardDetermine the minimum distance required to get from farm 1 to farm 6. The farmers decided to install cable for television and Internet connections. Determine the minimum amount of cable required to connect all 6 farms.arrow_forwardA new park is being developed with five campgrounds. Trails connecting each campground need to be constructed at the least cost. The cost is the same for each mile of trail in the entire park. Use the following table to determine the spanning tree with least cost. How many miles of trails is the least cost? Placid Abol Isolation Stream 10 36 3 * Roaring Brook Abol Isolation Placid Stream Moose Pond miles Roaring Brook * 37 4 10 25 37 * 29 36 21 4 29 * 3 11 16 Moose Pond 25 21 11 16 *arrow_forward
- Use the given minimum and maximum data entries, and the number of classes, to find the class width, the lower class limits, and the upper class limits. minimumequals=1616, maximumequals=133133, 88 classesarrow_forwardSee Picture. Thank you for your help. Questions 1) Construct comparative boxplots for the thicknesses of new wafers and recycled wafers. You have the option to create them by pencil and paper, or by Microsoft Excel spreadsheet (submit it with assignment, properly labeled), or by a graphing calculator (take pictures and submit them with assignment, properly labeled). A) Label each boxplot completely. B) Give the 5-Number Summary, mean, and standard deviation for both the new wafers and recycled wafers. You have the option to calculate them by pencil and paper (show all work), or by Microsoft Excel spreadsheet (submit with assignment, properly labeled), or by a graphing calculator (take pictures and submit with assignment, properly labeled).arrow_forward6.arrow_forward
arrow_back_ios
SEE MORE QUESTIONS
arrow_forward_ios
Recommended textbooks for you
 Advanced Engineering MathematicsAdvanced MathISBN:9780470458365Author:Erwin KreyszigPublisher:Wiley, John & Sons, Incorporated
 Numerical Methods for EngineersAdvanced MathISBN:9780073397924Author:Steven C. Chapra Dr., Raymond P. CanalePublisher:McGraw-Hill Education
 Introductory Mathematics for Engineering Applicat...Advanced MathISBN:9781118141809Author:Nathan KlingbeilPublisher:WILEY
 Mathematics For Machine TechnologyAdvanced MathISBN:9781337798310Author:Peterson, John.Publisher:Cengage Learning,


Advanced Engineering Mathematics
Advanced Math
ISBN:9780470458365
Author:Erwin Kreyszig
Publisher:Wiley, John & Sons, Incorporated

Numerical Methods for Engineers
Advanced Math
ISBN:9780073397924
Author:Steven C. Chapra Dr., Raymond P. Canale
Publisher:McGraw-Hill Education

Introductory Mathematics for Engineering Applicat...
Advanced Math
ISBN:9781118141809
Author:Nathan Klingbeil
Publisher:WILEY

Mathematics For Machine Technology
Advanced Math
ISBN:9781337798310
Author:Peterson, John.
Publisher:Cengage Learning,

