
ENGR.ECONOMIC ANALYSIS
14th Edition
ISBN: 9780190931919
Author: NEWNAN
Publisher: Oxford University Press
expand_more
expand_more
format_list_bulleted
Related questions
Question
thumb_up100%
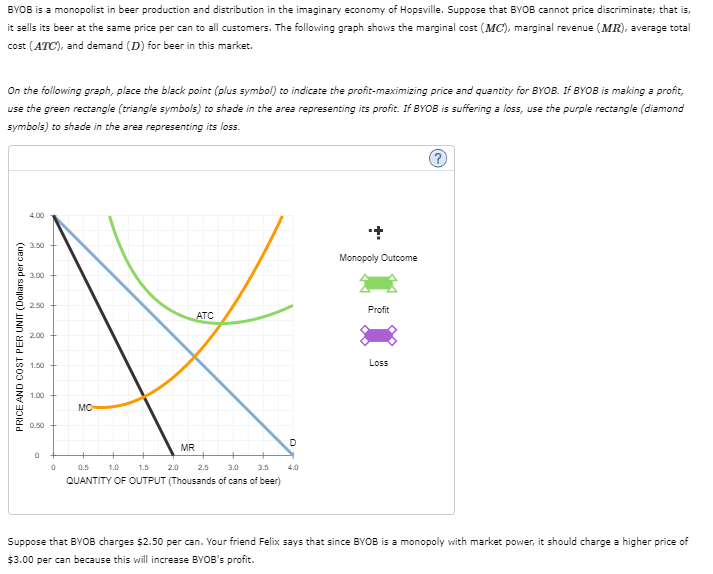
BYOB is a monopolist in beer production and distribution in the imaginary economy of Hopsville. Suppose that BYOB cannot price discriminate ; that is, it sells its beer at the same price per can to all customers. The following graph shows the marginal cost (MCMC), marginal revenue (MRMR), average total cost (ATCATC), and demand (D�) for beer in this market.
On the following graph, place the black point (plus symbol) to indicate the profit-maximizing price and quantity for BYOB. If BYOB is making a profit, use the green rectangle (triangle symbols) to shade in the area representing its profit. If BYOB is suffering a loss, use the purple rectangle (diamond symbols) to shade in the area representing its loss.
Suppose that BYOB charges $2.50 per can. Your friend Felix says that since BYOB is a monopoly with market power, it should charge a higher price of $3.00 per can because this will increase BYOB's profit.
Complete the following table to determine whether Felix is correct. (Hint: If BYOB is suffering a loss, enter a negative value for profit.)
|
Price
|
Quantity Demanded
|
Total Revenue
|
Total Cost
|
Profit
|
|---|---|---|---|---|
|
(Dollars per can)
|
(Cans)
|
(Dollars)
|
(Dollars)
|
(Dollars)
|
| 2.50 |
|
|
||
| 3.00 |
|
|
Given the earlier information, Felix correct in his assertion that BYOB should charge $3.00 per can.
Suppose that a technological innovation decreases BYOB’s costs so that it now faces the marginal cost (MCMC) and average total cost (ATCATC) given on the following graph. Specifically, the technological innovation causes a decrease in average fixed costs, thereby lowering the ATCATC curve and moving the MCMC curve.
On the following graph, place the black point (plus symbol) to indicate the profit-maximizing price and quantity for BYOB. If BYOB is making a profit, use the green rectangle (triangle symbols) to shade in the area representing its profit. If BYOB is suffering a loss, use the purple rectangle (diamond symbols) to shade in the area representing the loss.

Transcribed Image Text:BYOB is a monopolist in beer production and distribution in the imaginary economy of Hopsville. Suppose that BYOB cannot price discriminate; that is,
it sells its beer at the same price per can to all customers. The following graph shows the marginal cost (MC), marginal revenue (MR), average total
cost (ATC), and demand (D) for beer in this market.
On the following graph, place the black point (plus symbol) to indicate the profit-maximizing price and quantity for BYOB. If BYOB is making a profit,
use the green rectangle (triangle symbols) to shade in the area representing its profit. If BYOB is suffering a loss, use the purple rectangle (diamond
symbols) to shade in the area representing its loss.
4.00
PRICE AND COST PER UNIT (Dollars per can)
2.50
ATC
2.00
X
1.50
1.00
MC
MR
0.5
1.0
1.5
2.0
2.5
3.0 3.5
QUANTITY OF OUTPUT (Thousands of cans of beer)
3.50
3.00
0.50
0
D
4.0
Monopoly Outcome
Profit
Loss
Suppose that BYOB charges $2.50 per can. Your friend Felix says that since BYOB is a monopoly with market power, it should charge a higher price of
$3.00 per can because this will increase BYOB's profit.

Transcribed Image Text:Complete the following table to determine whether Felix is correct. (Hint: If BYOB is suffering a loss, enter a negative value for profit.)
Total Cost
Profit
Quantity Demanded Total Revenue
(Cans)
(Dollars)
(Dollars)
(Dollars)
Price
(Dollars per can)
2.50
3.00
Given the earlier information, Felix
Suppose that a technological innovation decreases BYOB's costs so that it now faces the marginal cost (MC) and average total cost (ATC) given on
the following graph. Specifically, the technological innovation causes a decrease in average fixed costs, thereby lowering the ATC curve and moving
the MC curve.
On the following graph, place the black point (plus symbol) to indicate the profit-maximizing price and quantity for BYOB. If BYOB is making a profit,
use the green rectangle (triangle symbols) to shade in the area representing its profit. If BYOB is suffering a loss, use the purple rectangle (diamond
symbols) to shade in the area representing the loss.
PRICE AND COST PER UNIT (Dollars per unit)
4.00
3.50
3.00
2.50
2.00
1.50
1.00
0.50
0
0
correct in his assertion that BYOB should charge $3.00 per can.
MO
MR
ATC
3.0 3.5
0.5 1.0 1.5 2.0 2.5
QUANTITY OF OUTPUT (Thousands of cans of beer)
D
4.0
Monopoly Outcome
Profit
Loss
Expert Solution
arrow_forward
Step 1
As per economics, a cost curve is a graph of the costs of production as a function of the aggregate quantity produced. In a free market economy, productively efficient business optimize their production process by minimizing costs consistent with every possible level of production, and the outcome is a cost curve.

Trending nowThis is a popular solution!

Step by stepSolved in 3 steps with 2 images

Knowledge Booster


Learn more about
Need a deep-dive on the concept behind this application? Look no further. Learn more about this topic, economics and related others by exploring similar questions and additional content below.Similar questions
- Place the black point (plus symbol) on the following graph to indicate the profit-maximizing price and quantity for BYOB. If BYOB is making a profit, use the green rectangle (triangle symbols) to shade in the area representing its profit. On the other hand, if BYOB is suffering a loss, use the purple rectangle (diamond symbols) to shade in the area representing the loss. 4.00 3.50 Monopoly Outcome 3.00 2.50 Profit 2.00 АТC 1.50 Loss 1.00 0.50 MC MR 0.5 1.0 1.5 2.0 2.5 3.0 3.5 4.0 QUANTITY (Thousands of cans of beer) PRICE (Dollars per unit)arrow_forwardYou are the manager of a monopolistic firm, and your demand and cost functions are given by P = 300 − 3Q and TC(Q) = C(Q) = 1,500 + 2Q2, What is the MR of the firm? What is the MC of the firm? Determine the profit maximizing level of price and output? How much profit will the monopolist make?arrow_forwardBYOB is a monopolist in beer production and distribution in the imaginary economy of Hopsville. Suppose that BYOB cannot price discriminate; that is, it sells its beer at the same price per can to all customers. The following graph shows the marginal cost (MC), marginal revenue (MR), average total cost (ATC), and demand (D) for beer in this market. Place the black point (plus symbol) on the graph to indicate the profit-maximizing price and quantity for BYOB. If BYOB is making a profit, use the green rectangle (triangle symbols) to shade in the area representing its profit. On the other hand, if BYOB is suffering a loss, use the purple rectangle (diamond symbols) to shade in the area representing its loss. Suppose that BYOB charges $2.50 per can. Your friend Charles says that since BYOB is a monopoly with market power, it should charge a higher price of $3.00 per can because this will increase BYOB’s profit. Complete the following table to determine whether Charles is…arrow_forward
- d. Suppose the government imposes an average pricing rule, requiring the monopolist to set its price equal to the average total cost. Place the point labeled “Average cost pricing” at the appropriate coordinates to indicate the firm's price and quantity under this rule. Please place the Monoploy Pricing, Marginal Cost Pricing, and Average Cost Pricing on their appropriate places on the graph. Thank you!arrow_forwardSuppose Barefeet is a monopolist that produces and sells Ooh boots, an amazingly trendy brand with no close substitutes. The following graph shows the market demand and marginal revenue (MR) curves Barefeet faces, as well as its marginal cost (MC), which is constant at $30 per pair of Ooh boots. For simplicity, assume that fixed costs are equal to zero; this, combined with the fact that Barefeet's marginal cost is constant, means that its marginal cost curve is also equal to the average total cost (ATC) curve. First, suppose that Barefeet cannot price discriminate. That is, it must charge each consumer the same price for Ooh boots regardless of the consumer's willingness and ability to pay. On the following graph, use the black point (plus symbol) to indicate the profit-maximizing price and quantity. Next, use the purple points (diamond symbol) to shade the profit, the green points (triangle symbol) to shade the consumer surplus, and the black points (plus symbol) to shade the…arrow_forwardYou are the manager of a monopoly. Your analytics department estimates that a typical consumer’s inverse demand function for your firm’s product is P = 200 − 20Q, and your cost function is C(Q) = 80Q.a. Determine the optimal two-part pricing strategy. Per-unit fee: $ Fixed fee: $ b. How much additional profit do you earn using a two-part pricing strategy compared with charging this consumer a per-unit price?arrow_forward
- You are the manager of a monopoly. Your analytics department estimates that a typical consumer’s inverse demand function for your firm’s product is P = 400 −20Q, and your cost function is C(Q) = 120Q.a. Determine the optimal two-part pricing strategy. Per-unit fee: $ Fixed fee: $ b. How much additional profit do you earn using a two-part pricing strategy compared with charging this consumer a per-unit price?arrow_forwardPlease read the following article from The Atlantic on the proliferation of price discrimination for online shopping https://goo.gl/EGFynW A.) The article notes that we are moving toward a situation in which perfect price discrimination is no longer “only a classroom thought experiment.” Suppose perfect price discrimination were to become a reality. What would this imply as far as consumer surplus, producer surplus, and market surplus in the market for online retail? B.) The article references a study showing that by using big data online firms are able to boost profits. When firms engage in price discrimination and experience an increase in profits, does this imply that consumers are made worse off as a result? Explain. C.) Do you agree with the author’s belief that the proliferation of price discrimination “makes suckers of us all”? Explain. D.) Do you consider the increased price discrimination in recent years as a net positive or a net negative to society? Explainarrow_forwardConsider a monopolistically competitive firm that faces demand curve P=160-3Q and total cost curve TC=100+Q². If this firm is profit-maximizing, what is the value of the average total cost (ATC) evaluated at Q*? (note: I am not asking for total costs. It's the value you would mark on your graph when you plug Q* into the ATC curve).arrow_forward
- BYOB is a monopolist in beer production and distribution in the imaginary economy of Hopsville. Suppose that BYOB cannot price discriminate; that is, it sells its beer at the same price per can to all customers. The following graph shows the marginal cost (MC), marginal revenue (MR), average total cost (ATC), and demand (D) for beer in this market. Place the black point (plus symbol) on the graph to indicate the profit-maximizing price and quantity for BYOB. If BYOB is making a profit, use the green rectangle (triangle symbols) to shade in the area representing its profit. On the other hand, if BYOB is suffering a loss, use the purple rectangle (diamond symbols) to shade in the area representing its loss. PRICE (Dollars per can) 4.00 3.50 3.00 2.50 2.00 1.50 1.00 0.50 0 MC 0 0.5 1.5 ATC MR D 1.0 2.0 2.5 3.0 QUANTITY (Thousands of cans of beer) 3.5 4.0 Monopoly Outcome Profit Lossarrow_forwardLagatt Green is a monopoly beer producer and distributor operating in the hypothetical economy of Lightington. Assume that Lagatt Green is not able price discriminate, and so it sells its beer to all customers at the same price per bottle. The following graph gives the marginal cost (MC), marginal revenue (MR), average total cost (ATC), and demand (D) curves that Lagatt Green faces for beer in Lightington. Place the black point (plus symbol) on the graph to indicate the profit-maximizing price and quantity for Lagatt Green. If Lagatt Green is making a profit, use the green rectangle (triangle symbols) to shade in the area representing its profit. On the other hand, if Lagatt Green is suffering a loss, use the purple rectangle (diamond symbols) to shade in the area representing its loss. PRICE (Dollars per bottle) 4.00 3.50 3.00 2.50 2.00 1.50 1.00 0.50 D MC D 15 20 25 30 3.5 QUANTITY (Thousands of bottles of beer) 45 ATC MR Price (Dollars per bottle) 2.00 2.25 40 Monopoly Outcome…arrow_forwardYou are the manager of a monopoly. Your analytics department estimates that a typical consumer's inverse demand function for your firm's product is P = 350-20Q, and your cost function is C(Q) = 70Q. a. Determine the optimal two - part pricing strategy. Per-unit fee: $ Fixed fee: $ b. How much additional profit do you earn using a two-part pricing strategy compared with charging this consumer a per- unit price? $arrow_forward
arrow_back_ios
SEE MORE QUESTIONS
arrow_forward_ios
Recommended textbooks for you
 Principles of Economics (12th Edition)EconomicsISBN:9780134078779Author:Karl E. Case, Ray C. Fair, Sharon E. OsterPublisher:PEARSON
 Engineering Economy (17th Edition)EconomicsISBN:9780134870069Author:William G. Sullivan, Elin M. Wicks, C. Patrick KoellingPublisher:PEARSON
 Principles of Economics (MindTap Course List)EconomicsISBN:9781305585126Author:N. Gregory MankiwPublisher:Cengage Learning
 Managerial Economics: A Problem Solving ApproachEconomicsISBN:9781337106665Author:Luke M. Froeb, Brian T. McCann, Michael R. Ward, Mike ShorPublisher:Cengage Learning
 Managerial Economics & Business Strategy (Mcgraw-...EconomicsISBN:9781259290619Author:Michael Baye, Jeff PrincePublisher:McGraw-Hill Education
Principles of Economics (12th Edition)
Economics
ISBN:9780134078779
Author:Karl E. Case, Ray C. Fair, Sharon E. Oster
Publisher:PEARSON
Engineering Economy (17th Edition)
Economics
ISBN:9780134870069
Author:William G. Sullivan, Elin M. Wicks, C. Patrick Koelling
Publisher:PEARSON
Principles of Economics (MindTap Course List)
Economics
ISBN:9781305585126
Author:N. Gregory Mankiw
Publisher:Cengage Learning
Managerial Economics: A Problem Solving Approach
Economics
ISBN:9781337106665
Author:Luke M. Froeb, Brian T. McCann, Michael R. Ward, Mike Shor
Publisher:Cengage Learning
Managerial Economics & Business Strategy (Mcgraw-...
Economics
ISBN:9781259290619
Author:Michael Baye, Jeff Prince
Publisher:McGraw-Hill Education