
MATLAB: An Introduction with Applications
6th Edition
ISBN: 9781119256830
Author: Amos Gilat
Publisher: John Wiley & Sons Inc
expand_more
expand_more
format_list_bulleted
Related questions
Question
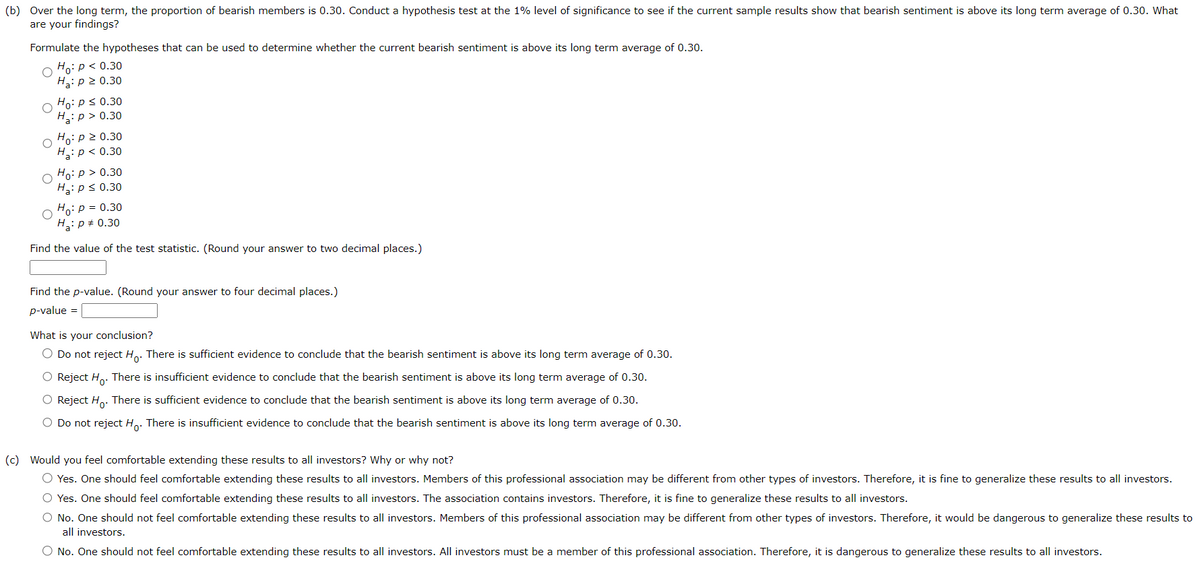

Transcribed Image Text:(b) Over the long term, the proportion of bearish members is 0.30. Conduct a hypothesis test at the 1% level of significance to see if the current sample results show that bearish sentiment is above its long term average of 0.30. What
are your findings?
Formulate the hypotheses that can be used to determine whether the current bearish sentiment is above its long term average of 0.30.
Ho: P < 0.30
H₂: P≥ 0.30
O
Ho: P ≤ 0.30
H₂: p > 0.30
Ho: P≥ 0.30
H₂: P < 0.30
Ho: p > 0.30
Ha: p ≤ 0.30
Ho: P = 0.30
H₂: P = 0.30
Find the value of the test statistic. (Round your answer two decimal places.)
Find the p-value. (Round your answer to four decimal places.)
p-value =
What is your conclusion?
O Do not reject Ho. There is sufficient evidence to conclude that the bearish sentiment is above its long term average of 0.30.
O Reject Ho. There is insufficient evidence to conclude that the bearish sentiment is above its long term average of 0.30.
O Reject Ho. There is sufficient evidence to conclude that the bearish sentiment is above its long term average of 0.30.
O Do not reject Ho. There is insufficient evidence to conclude that the bearish sentiment is above its long term average of 0.30.
(c) Would you feel comfortable extending these results to all investors? Why or why not?
O Yes. One should feel comfortable extending these results to all investors. Members of this professional association may be different from other types of investors. Therefore, it is fine to generalize these results to all investors.
O Yes. One should feel comfortable extending these results to all investors. The association contains investors. Therefore, it is fine to generalize these results to all investors.
O No. One should not feel comfortable extending these results to all investors. Members of this professional association may be different from other types of investors. Therefore, it would be dangerous to generalize these results to
all investors.
O No. One should not feel comfortable extending these results to all investors. All investors must be a member of this professional association. Therefore, it is dangerous to generalize these results to all investors.

Transcribed Image Text:One particular professional association of investors conducts a weekly survey of its members to measure the percent who are bullish, bearish, and neutral on the stock market for the next six months. The survey results showed 37.7%
bullish, 23.4% neutral, and 38.9% bearish. Assume these results are based on a sample of 300 members.
(a) Over the long term, the proportion of bullish members is 0.39. Conduct a hypothesis test at the 5% level of significance to see if the current sample results show that bullish sentiment differs from its long term average of 0.39. What
are your findings?
Formulate the hypotheses that can be used to determine whether the bullish sentiment differs from its long term average of 0.39.
Ho: P≥ 0.39
O
H₂: P < 0.39
Ho: P ≤ 0.39
Ha: p > 0.39
Ho: P < 0.39
H₂: P≥ 0.39
Ho: p > 0.39
Ha: p ≤ 0.39
Ho: P = 0.39
H₂: P = 0.39
Find the value of the test statistic. (Round your answer to two decimal places.)
Find the p-value. (Round your answer to four decimal places.)
p-value =
What is your conclusion?
O Do not reject Ho. There is insufficient evidence to conclude that the bullish sentiment differs from its long term average of 0.39.
O Reject Ho. There is sufficient evidence to conclude that the bullish sentiment differs from its long term average of 0.39.
Do not reject Ho. There is sufficient evidence to conclude that the bullish sentiment differs from its long term average of 0.39.
O Reject Ho. There is insufficient evidence to conclude that the bullish sentiment differs from its long term average of 0.39.
Expert Solution
This question has been solved!
Explore an expertly crafted, step-by-step solution for a thorough understanding of key concepts.

This is a popular solution

Trending nowThis is a popular solution!

Step by stepSolved in 4 steps with 2 images

Knowledge Booster

Similar questions
- You are conducting a study to see if the accuracy rate for fingerprint identification is significantly different from 0.51. You use a significance level of a = 0.001. Ho:p = 0.51 H₁:p 0.51 You obtain a sample of size n = 373 in which there are 169 successes. What is the p-value for this sample? (Report answer accurate to four decimal places.) p-value = The p-value is... O less than (or equal to) a greater than a This p-value leads to a decision to... O reject the null O accept the null O fail to reject the null As such, the final conclusion is that... O There is sufficient evidence to warrant rejection of the claim that the accuracy rate for fingerprint identification is different from 0.51. O There is not sufficient evidence to warrant rejection of the claim that the accuracy rate for fingerprint identification is different from 0.51. O The sample data support the claim that the accuracy rate for fingerprint identification is different from 0.51. O There is not sufficient sample…arrow_forwardYou are conducting a study to see if the proportion of voters who prefer Candidate A is significantly more than 0.57. You use a significance level of a = 0.001. Ho:p = 0.57 H1:p > 0.57 You obtain a sample of size n = 331 in which there are 211 successes.arrow_forwardYou are conducting a study to see if the proportion of voters who prefer Candidate A is significantly less than 0.52. You use a significance level of a = 0.01. Ho:p = 0.52 H1:p < 0.52 You obtain a sample of size n = 414 in which there are 208 successes. What is the p-value for this sample? (Report answer accurate to four decimal places.) p-value = The p-value is... less than (or equal to) a greater than a This p-value leads to a decision to... reject the null accept the null O fail to reject the nullarrow_forward
- Looking at youth depression scores from a general sample of random children in the US, we want to determine if our sample is significantly different than the national average of scores of children with depression in the US. The national average of scores on a measure of depression is 5 points. We have no reason to assume it will be higher or lower than the US national average. The sample: 11 9 12 3 3 4 13 1. What is the null and alternative hypotheses? Do not specify any directionality. 2. What did you discover (using 95% Cl)? Provide an interpretation.arrow_forwardeconometricsarrow_forwardUp-County Associates is hired to estimate the proportion of county households that own three or more automobiles. They conducted their survey using a simple random sample of 250 randomly selected households and found that 23% of those households owned three or more automobiles. (a) Is the proportion, 23%, a parameter or a statistic? Explain. (b) If Up-County Associates were to continually choose simple random samples of 250 randomly selected households, each time recording the proportion of households in the sample owning three or more automobiles, what would be the “shape” of the resulting distribution of all these sample proportions? Explain. (c) Suppose now that survey company Lower-County Polling also conducted a survey to determine the proportion of county households that own three or more automobiles, but they surveyed only 100 randomly selected households. If Lower-County Polling were also to sample over and over again (using simple random samples…arrow_forward
- You are conducting a hypothesis test on the outcome of an Statistics test at a large state University. Your null hypothesis is that the overall class average is less than or equal to 0.80. You take a sample of 64 people (a large sample), and find that the sample average is 0.82, and the standard deviation is 0.05. Your hypothesis test will be conducted at the 0.01 significance level. You calculate your test statistic would be 3.20. Would your test statistic be higher or lower if, instead, you were testing at the 0.01 level? Group of answer choices Lower HIgher The same (neigher higher, nor lower).arrow_forwardwith workarrow_forward
arrow_back_ios
arrow_forward_ios
Recommended textbooks for you
- MATLAB: An Introduction with ApplicationsStatisticsISBN:9781119256830Author:Amos GilatPublisher:John Wiley & Sons Inc
 Probability and Statistics for Engineering and th...StatisticsISBN:9781305251809Author:Jay L. DevorePublisher:Cengage Learning
 Statistics for The Behavioral Sciences (MindTap C...StatisticsISBN:9781305504912Author:Frederick J Gravetter, Larry B. WallnauPublisher:Cengage Learning
  Elementary Statistics: Picturing the World (7th E...StatisticsISBN:9780134683416Author:Ron Larson, Betsy FarberPublisher:PEARSON
 The Basic Practice of StatisticsStatisticsISBN:9781319042578Author:David S. Moore, William I. Notz, Michael A. FlignerPublisher:W. H. Freeman
 Introduction to the Practice of StatisticsStatisticsISBN:9781319013387Author:David S. Moore, George P. McCabe, Bruce A. CraigPublisher:W. H. Freeman
MATLAB: An Introduction with Applications
Statistics
ISBN:9781119256830
Author:Amos Gilat
Publisher:John Wiley & Sons Inc
Probability and Statistics for Engineering and th...
Statistics
ISBN:9781305251809
Author:Jay L. Devore
Publisher:Cengage Learning
Statistics for The Behavioral Sciences (MindTap C...
Statistics
ISBN:9781305504912
Author:Frederick J Gravetter, Larry B. Wallnau
Publisher:Cengage Learning
Elementary Statistics: Picturing the World (7th E...
Statistics
ISBN:9780134683416
Author:Ron Larson, Betsy Farber
Publisher:PEARSON
The Basic Practice of Statistics
Statistics
ISBN:9781319042578
Author:David S. Moore, William I. Notz, Michael A. Fligner
Publisher:W. H. Freeman
Introduction to the Practice of Statistics
Statistics
ISBN:9781319013387
Author:David S. Moore, George P. McCabe, Bruce A. Craig
Publisher:W. H. Freeman