MATLAB: An Introduction with Applications
6th Edition
ISBN: 9781119256830
Author: Amos Gilat
Publisher: John Wiley & Sons Inc
expand_more
expand_more
format_list_bulleted
Question
thumb_up100%
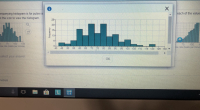
The accompanying histogram is for pulse rates for 125 people. Convert the vertical axis to relative frequency and shows the values that would replace each of the values on the vertical axis.

Transcribed Image Text:257
20-
15-
10-
5-
40
45 50 55 60 85
70 75
80 85
95 100 105 110 115 120 125 130
OK
Frequency

Expert Solution
This question has been solved!
Explore an expertly crafted, step-by-step solution for a thorough understanding of key concepts.
This is a popular solution
Trending nowThis is a popular solution!
Step by stepSolved in 2 steps with 3 images

Knowledge Booster
Learn more about
Need a deep-dive on the concept behind this application? Look no further. Learn more about this topic, statistics and related others by exploring similar questions and additional content below.Similar questions
- A researcher records the gender of each child born in the county hospital during the month of June. This researcher is measuring a discrete variable. O True O Falsearrow_forwardA professor records the following final grades in one course. Construct a frequency table for the grades. A A A A B B B B C C C C D D A C B C C BD 4F F Complete the table. (Type an integer or decimal rounded to the nearest tenth as needed.) Grade Frequency Relative frequency Cumulative frequency A % 0arrow_forwardHow do I create a histogram in excel?arrow_forward
- Approximately 1 percent of women ages 40-50 have breast cancer. A woman has a 80 percent chance of a positive test from a mammogram given she has breast cancer (a true positive result). A woman has a 12 percent chance of a positive test from a mammogram given she does not have breast cancer (a false positive result). Complete the table below, then answer the questions below the table. Give all answers as decimals to 4 decimal places. Positive test result Negative test result TotalHas breast cancer Does not have breast cancer Total What is the probability a woman has breast cancer given that she just had a positive test? Give answer as decimals to 4 decimal places.arrow_forwardThe table gives the frequency distribution for the final grades in a course. (Here A=4, B=3, C=2, D=1,F=0.) Determine the percentage of students who get a B or higher. Grade 0 1 2 3 4 Number of Occurrences 3 6 4 3 How could the answer be found? OA. Add the number of occurrences for each grade that is a B or higher. Then, divide by the number of grades. OB. Find the probability of each grade. Then, add them together to find the percent OC. Find the probability of each grade that is a B or higher. Then, find the average of those probabilities. OD. Find the probability of each grade. Then, add the probabilities for the grades that are a B or higher together to find the percent. The percentage of students who get a B or higher isarrow_forwardCalculate ¯xx¯ (x-bar) for the data shown, to two decimal places x 8.3 8.7 5 5.5 26.6arrow_forward
- Thank you, but would the first column on the histogram not be at a frequency of 3? Would you please now answer the remaining part of the question. Thanks for your helparrow_forwardHow do I determine each individual time on this box plot? i dont know how Im supposed to answer the questions following without knowing each individual time.arrow_forwardMatch each scatterplot shown below with the best desciption of its correlation. 880 000 Lo Select an answer Select an answer Select an answerarrow_forward
- Briefly define: Power, Type I error, and Type II error.arrow_forwardThe ages (in years) and helghts (in inches) of all pitchers for a beseball team are listed. Find the coefficient of variation for each of the two data sets. Then compare the results. -Click the Icon to view the data sets. CV. %D Round to one decimal place as needed.)arrow_forwardComplete the table below:arrow_forward
arrow_back_ios
SEE MORE QUESTIONS
arrow_forward_ios
Recommended textbooks for you
 MATLAB: An Introduction with ApplicationsStatisticsISBN:9781119256830Author:Amos GilatPublisher:John Wiley & Sons Inc
 Probability and Statistics for Engineering and th...StatisticsISBN:9781305251809Author:Jay L. DevorePublisher:Cengage Learning
 Statistics for The Behavioral Sciences (MindTap C...StatisticsISBN:9781305504912Author:Frederick J Gravetter, Larry B. WallnauPublisher:Cengage Learning
 Elementary Statistics: Picturing the World (7th E...StatisticsISBN:9780134683416Author:Ron Larson, Betsy FarberPublisher:PEARSON
 The Basic Practice of StatisticsStatisticsISBN:9781319042578Author:David S. Moore, William I. Notz, Michael A. FlignerPublisher:W. H. Freeman
 Introduction to the Practice of StatisticsStatisticsISBN:9781319013387Author:David S. Moore, George P. McCabe, Bruce A. CraigPublisher:W. H. Freeman

MATLAB: An Introduction with Applications
Statistics
ISBN:9781119256830
Author:Amos Gilat
Publisher:John Wiley & Sons Inc

Probability and Statistics for Engineering and th...
Statistics
ISBN:9781305251809
Author:Jay L. Devore
Publisher:Cengage Learning

Statistics for The Behavioral Sciences (MindTap C...
Statistics
ISBN:9781305504912
Author:Frederick J Gravetter, Larry B. Wallnau
Publisher:Cengage Learning

Elementary Statistics: Picturing the World (7th E...
Statistics
ISBN:9780134683416
Author:Ron Larson, Betsy Farber
Publisher:PEARSON

The Basic Practice of Statistics
Statistics
ISBN:9781319042578
Author:David S. Moore, William I. Notz, Michael A. Fligner
Publisher:W. H. Freeman

Introduction to the Practice of Statistics
Statistics
ISBN:9781319013387
Author:David S. Moore, George P. McCabe, Bruce A. Craig
Publisher:W. H. Freeman