
MATLAB: An Introduction with Applications
6th Edition
ISBN: 9781119256830
Author: Amos Gilat
Publisher: John Wiley & Sons Inc
expand_more
expand_more
format_list_bulleted
Related questions
Question
thumb_up100%
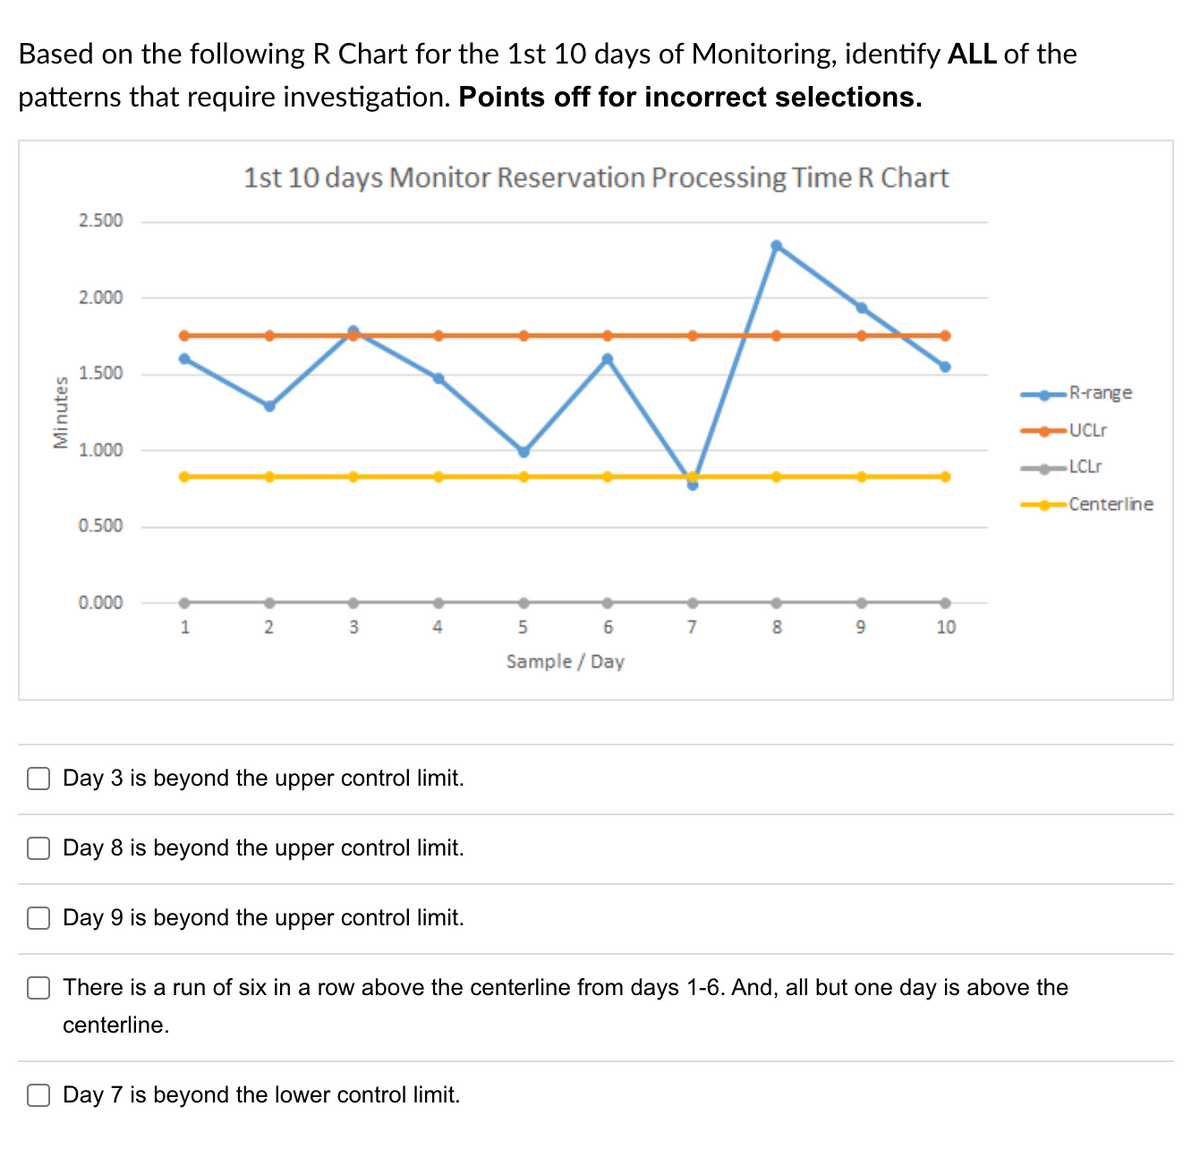

Transcribed Image Text:Based on the following R Chart for the 1st 10 days of Monitoring, identify ALL of the
patterns that require investigation. Points off for incorrect selections.
Minutes
2.500
2.000
1.500
1.000
0.500
0.000
1
1st 10 days Monitor Reservation Processing Time R Chart
2
3
4
Day 3 is beyond the upper control limit.
Day 8 is beyond the upper control limit.
Day 9 is beyond the upper control limit.
5
6
Sample / Day
Day 7 is beyond the lower control limit.
7
8
00
9
10
There is a run of six in a row above the centerline from days 1-6. And, all but one day is above the
centerline.
R-range
UCLr
LCLr
Centerline

Transcribed Image Text:A
B
C
1 RESERVATION TIME in MINUTES
2
3
456780
9
10
11
12
13
14
15
16
17
18
19
20
21
22
23
24
25
26
27
28
29
30
31
32
33
34
35
36
37
38
Day
1
2
3
4
5
6
7
8
9
10
11
12
13
14
15
16
17
18
19
20
21
22
23
24
25
26
27
28
29
30
Ready
Data Set
1
4.5
3.7
4.3
3.7
4.4
3.5
4.5
3.6
4.4
4.3
3.7
4.5
4.2
4.2
3.7
4.6
4.2
4.4
4.2
4.3
4.6
4.1
3.6
4.1
4.3
4.4
3.6
3.5
4.5
4.4
+
2
3.8
4.6
3.5
3.7
4.6
3.5
4.3
3.6
3.5
4.3
3.5
3.5
4.3
4.2
4.5
4.4
3.5
3.4
3.4
4.5
4.6
4.3
4.0
4.5
4.1
4.6
3.8
3.5
4.2
3.5
D
Accessibility: Good to go
3
3.9
4.2
4.2
4.4
3.8
4.3
4.1
4.4
4.6
4.0
4.2
3.8
3.4
4.0
4.6
4.5
4.4
3.6
3.4
4.5
4.0
3.6
3.6
3.6
3.5
4.5
4.0
4.3
3.9
4.1
E
4
4.4
3.9
4.1
4.4
4.6
4.3
4.5
3.7
3.6
3.5
3.7
4.2
4.4
3.8
3.5
3.8
3.4
3.9
4.3
3.6
4.4
4.5
3.4
3.9
3.9
4.4
3.7
4.2
3.8
4.1
TI
F
5
4.0
3.9
4.3
3.6
4.3
3.4
3.5
3.8
4.1
3.8
3.9
4.1
3.6
4.1
3.5
4.3
3.7
4.3
4.0
3.6
3.9
3.8
3.5
3.4
3.5
4.2
3.9
4.6
4.0
4.4
G
H
Day
1
2
3
4
5
6
7
8
9
10
I
Day
1
2
3
4
5
6
7
8
9
10
1st 10 Days of Monitoring Reservation Processing Time
1
3
4
3.5
4.4
4.9
3.9
4.2
3.3
4.3
5.1
5.2
3.5
J
5.0
4.3
4.4
4.2
4.3
4.2
3.7
4.0
4.2
4.0
2
4.5
3.5
3.2
ا ب ا ب ا ب
3.7
3.8
3.6
4.6
5.2
3.3
3.8
K
2
4.3
4.1
4.4
3.8
4.1
4.3
3.6
4.3
4.6
4.4
3.4
4.3
3.4
3.5
3.4
4.4
4.1
2.8
3.9
4.5
L
2nd 10 Days of Monitoring Reservation Processing Time
1
3
4
4.1
4.3
4.2
4.0
4.2
4.2
4.6
4.3
4.1
4.2
4.7
3.1
3.1
4.6
4.3
4.9
4.8
4.9
5.1
3.8
M
4.5
4.3
4.1
4.9
4.3
4.3
3.4
4.0
4.0
4.4
5
5.0
3.1
4.9
3.1
3.5
3.3
4.4
4.2
3.3
5.1
5
4.2
4.2
4.0
4.1
4.2
4.4
3.8
4.3
3.8
4.2
N
O
P
Q
R
S
B
II
T
I
U
V
+
115%
W
Expert Solution
This question has been solved!
Explore an expertly crafted, step-by-step solution for a thorough understanding of key concepts.

Step by stepSolved in 3 steps

Knowledge Booster

Similar questions
- Below are the times (in days) it takes for a sample of 14 customers from Andrew's computer store to pay their invoices. 19, 15, 43, 39, 35, 31, 42, 42, 42, 38, 38, 38, 34, 34 Send data to calculator Draw the histogram for these data using an initial class boundary of 14.5, an ending class boundary of 50.5, and 4 classes of equal width. Note that you can add or remove classes from the figure. Label each class with its endpoints. Frequency 8+ 7+ 6+ 5+ 4+ 3- 2- ? Time (in days)arrow_forwardThe following items represent the number of birds observed at a given feeder over the past several days. What is the mean number of birds to visit that feeder? 96, 33, 87, 59, 42, 68, 44, 70 Round to 2 decimal places as neededarrow_forwardThe following is a stem and leaf plot for miles driven to work for a sample of social workers. 1 2 2 3 4 5 6 2 1 2 3 4 5 6 3 0 0 1 3 4 5 4 1 2 5 0 3 6 7 Answer the following question The sample size is 23. (True or False)arrow_forward
- The following are the distances (in miles) to the nearest airport for 12 families. 7, 9, 11, 15, 21, 22, 31, 32, 35, 35, 40, 45 Notice that the numbers are ordered from least to greatest. Give the five-number summary and the interquartile range for the data set. Five-number summary || Minimum: Lower quartile: Median: Upper quartile: Maximum: Interquartile range: X 1 1 0 Śarrow_forwardThe following items represent the number of birds observed at a given feeder over the past several days. What is the median number of birds to visit that feeder? 99, 37, 21, 12, 75, 58, 2 Round to 2 decimal places as neededarrow_forwardThe price per share of stock for a sample of 25 companies was recorded at the beginning of the first financial quarter and then again at the end of the first financial quarter. How stocks perform during the first quarter is an indicator of what is ahead for the stock market and the economy. Use the sample data in the file StockQuarter to answer the following.arrow_forward
- The following items represent the number of birds observed at a given feeder over the past several days. What is the mean number of birds to visit that feeder? 62, 7, 98, 18, 32, 85 Round to 2 decimal places as needed Your Answer: Answerarrow_forwardThe following are the annual incomes (in thousands of dollars) for 24 randomly chosen, U.S. adults employed full-time. 28, 31, 32, 33, 34, 36, 38, 38, 38, 38, 41, 42, 43, 43, 44, 47, 48, 50, 54, 55, 61, 82, 96, 107 Send data to calculator Send data to Excel Frequency 15 10+ 15 6 5. 25 45 65 1 1 1 85 105 125 Annual income (in thousands of dollars) Answer the questions below. (a) For these data, which measures of central tendency take more than one value? Choose all that apply. Mean Median Mode ☐ None of these measures Mean (b) Suppose that the measurement 28 (the smallest measurement in the data set) were ☐ Median replaced by 10 Which measures of centralarrow_forwardwhat number completes the following dístríbution containing 3 trials? 3. PlX) 0.25 0.35 0.30arrow_forward
- A. Identify the class that contains the 50th percentile .is this the time of a typical time ?identify the runners in the 50 percentile? Show all work B. Find the first second and third quartiles? Show your work arrow_forward3. A. A sales manager at Cherry Lake Tree Farm in Lake County believes that the mean number of days per year that her company's sales representatives spend traveling is less than 79. Identify the test. right-tailed B. two-tailed C. left-tailedarrow_forwardFor the following sample 35, 30, 45 , 37, 40, 25 . Find the median Select one: a. 41 b. 35 c. 36 d. 40arrow_forward
arrow_back_ios
SEE MORE QUESTIONS
arrow_forward_ios
Recommended textbooks for you
- MATLAB: An Introduction with ApplicationsStatisticsISBN:9781119256830Author:Amos GilatPublisher:John Wiley & Sons Inc
 Probability and Statistics for Engineering and th...StatisticsISBN:9781305251809Author:Jay L. DevorePublisher:Cengage Learning
 Statistics for The Behavioral Sciences (MindTap C...StatisticsISBN:9781305504912Author:Frederick J Gravetter, Larry B. WallnauPublisher:Cengage Learning
  Elementary Statistics: Picturing the World (7th E...StatisticsISBN:9780134683416Author:Ron Larson, Betsy FarberPublisher:PEARSON
 The Basic Practice of StatisticsStatisticsISBN:9781319042578Author:David S. Moore, William I. Notz, Michael A. FlignerPublisher:W. H. Freeman
 Introduction to the Practice of StatisticsStatisticsISBN:9781319013387Author:David S. Moore, George P. McCabe, Bruce A. CraigPublisher:W. H. Freeman
MATLAB: An Introduction with Applications
Statistics
ISBN:9781119256830
Author:Amos Gilat
Publisher:John Wiley & Sons Inc
Probability and Statistics for Engineering and th...
Statistics
ISBN:9781305251809
Author:Jay L. Devore
Publisher:Cengage Learning
Statistics for The Behavioral Sciences (MindTap C...
Statistics
ISBN:9781305504912
Author:Frederick J Gravetter, Larry B. Wallnau
Publisher:Cengage Learning
Elementary Statistics: Picturing the World (7th E...
Statistics
ISBN:9780134683416
Author:Ron Larson, Betsy Farber
Publisher:PEARSON
The Basic Practice of Statistics
Statistics
ISBN:9781319042578
Author:David S. Moore, William I. Notz, Michael A. Fligner
Publisher:W. H. Freeman
Introduction to the Practice of Statistics
Statistics
ISBN:9781319013387
Author:David S. Moore, George P. McCabe, Bruce A. Craig
Publisher:W. H. Freeman