MATLAB: An Introduction with Applications
6th Edition
ISBN: 9781119256830
Author: Amos Gilat
Publisher: John Wiley & Sons Inc
expand_more
expand_more
format_list_bulleted
Question

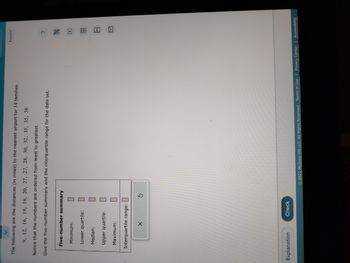
Transcribed Image Text:The following are the distances (in miles) to the nearest airport for 14 families:
9, 12, 16, 19, 19, 20, 22, 27, 28, 30, 32, 35, 35, 36
Notice that the numbers are ordered from least to greatest.
Give the five-number summary and the interquartile range for the data set.
**Five-number summary:**
- Minimum:
- Lower quartile:
- Median:
- Upper quartile:
- Maximum:
**Interquartile range:**
There is a diagram below the text, which is a graphical representation of a five-number summary plot (or box plot). It indicates the minimum, lower quartile, median, upper quartile, and maximum values for the data set. Each value is aligned with a labeled segment, offering a visual reference for analyzing the spread and range of the data.
Expert Solution
This question has been solved!
Explore an expertly crafted, step-by-step solution for a thorough understanding of key concepts.
Step by stepSolved in 5 steps

Knowledge Booster
Similar questions
- Which of the three measurements, mean, median, or mode, is the most influenced by an outlier value that is either much higher or lower than the others in the dataset? Explain how you chose your answer in the space provided below.arrow_forwardCheck if this is correctarrow_forwardFind the 5 number summary for the data shown x 3.9 5.4 6.5 8.9 11.3 11.8 24.6 27.8 28.4 5 number summary:3.9 ____, ______, ______, 28.4Use the Locator/Percentile method described in your book, not your calculatorarrow_forward
- Which of the following is NOT an appropriate display for the variable of Grade Point Average? Group of answer choices Dot Plot Scatterplot Boxplot Stem and Leaf Plot Histogramarrow_forwardHere are the scores of 13 students on a geography test. 59, 60, 61, 61, 67, 71, 73, 74, 85, 85, 86, 88, 89 Notice that the scores are ordered from least to greatest. Give the five-number summary and the interquartile range for the data set. Five-number summary Minimum: Lower quartile: Median: Upper quartile: Maximum: Interquartile range: 0arrow_forwardThe ages (in years)and heights (in inches) of all pitchers for a baseball team are listed. Find the cofficient of a variation for each of the two data sets. Then compare the result.arrow_forward
- Below are numbers of hours that a sample of 19 college graduates reported working last week. 50, 58, 57, 52, 41, 38, 46, 53, 58, 68, 48, 52, 57, 65, 44, 62, 47, 42, 63 Send data to calculator Send data to Excel Using the tool provided, construct a box-and-whisker plot (sometimes called a boxplot) for the data. ? +++++D 50 55 60 65 70 35 40 45 Number of hours workedarrow_forwardDetermine the interquartile range of the following data: 155, 134, 153, 119, 89.arrow_forwardFor the project, you will have to: Collect and organize a sample of 30 items of data from a source you find relevant. Some examples: Sports (top HR hitters, rushing leaders, point scorers, etc.) Weather (average daily temperature for a month, max hurricane wind speed, etc.) Business (top-grossing movies, highest-paid athletes, record sales, etc.) Demographics (age, height, weight, etc.) Find the mean, median, mode, and mid-range for your date. Find the variance, standard deviation, and range for your data. Find the five-number summary and determine (mathematically) if there are any outliers. Construct a 95% confidence interval for the mean of your data. You are allowed to use the calculator for the calculations but you must provide me with the 30 data values you obtain in a neat, organized manner, preferably in a spreadsheet. Also, be sure to provide the source of your data. When you provide the answers to the questions above please use the correct symbols and notation.…arrow_forward
- Draw a box plot for the following data: Median: 4.5 Lowest Value: 1 Greatest Value: 9 Lower Quartile: 2.5 Interquartile Range: 6 8 10arrow_forwardThe 5-number summary for a specific data set is given below. Use this information to determine if the data has any outliers. If it does, list one known outlier. If not, type the number 0. min = 2, Q1 = 3, median = 4, Q3 = 7, max = 12arrow_forwardPlease help me answer in fullarrow_forward
arrow_back_ios
SEE MORE QUESTIONS
arrow_forward_ios
Recommended textbooks for you
 MATLAB: An Introduction with ApplicationsStatisticsISBN:9781119256830Author:Amos GilatPublisher:John Wiley & Sons Inc
 Probability and Statistics for Engineering and th...StatisticsISBN:9781305251809Author:Jay L. DevorePublisher:Cengage Learning
 Statistics for The Behavioral Sciences (MindTap C...StatisticsISBN:9781305504912Author:Frederick J Gravetter, Larry B. WallnauPublisher:Cengage Learning
 Elementary Statistics: Picturing the World (7th E...StatisticsISBN:9780134683416Author:Ron Larson, Betsy FarberPublisher:PEARSON
 The Basic Practice of StatisticsStatisticsISBN:9781319042578Author:David S. Moore, William I. Notz, Michael A. FlignerPublisher:W. H. Freeman
 Introduction to the Practice of StatisticsStatisticsISBN:9781319013387Author:David S. Moore, George P. McCabe, Bruce A. CraigPublisher:W. H. Freeman

MATLAB: An Introduction with Applications
Statistics
ISBN:9781119256830
Author:Amos Gilat
Publisher:John Wiley & Sons Inc

Probability and Statistics for Engineering and th...
Statistics
ISBN:9781305251809
Author:Jay L. Devore
Publisher:Cengage Learning

Statistics for The Behavioral Sciences (MindTap C...
Statistics
ISBN:9781305504912
Author:Frederick J Gravetter, Larry B. Wallnau
Publisher:Cengage Learning

Elementary Statistics: Picturing the World (7th E...
Statistics
ISBN:9780134683416
Author:Ron Larson, Betsy Farber
Publisher:PEARSON

The Basic Practice of Statistics
Statistics
ISBN:9781319042578
Author:David S. Moore, William I. Notz, Michael A. Fligner
Publisher:W. H. Freeman

Introduction to the Practice of Statistics
Statistics
ISBN:9781319013387
Author:David S. Moore, George P. McCabe, Bruce A. Craig
Publisher:W. H. Freeman