
MATLAB: An Introduction with Applications
6th Edition
ISBN: 9781119256830
Author: Amos Gilat
Publisher: John Wiley & Sons Inc
expand_more
expand_more
format_list_bulleted
Related questions
Question
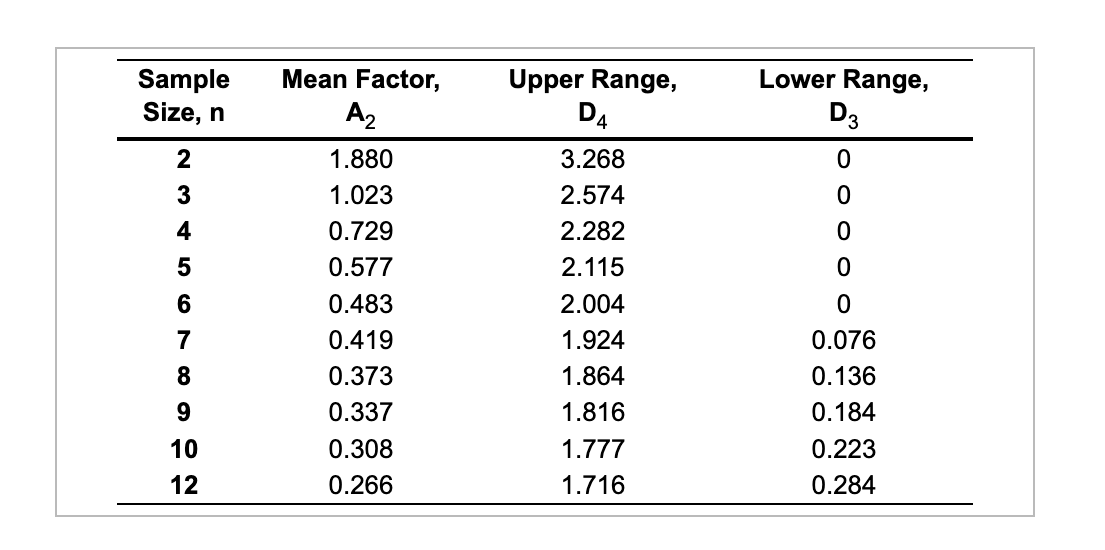

Transcribed Image Text:Sample
Size, n
2
3
4
5
6
7
8912
10
Mean Factor,
A₂
1.880
1.023
0.729
0.577
0.483
0.419
0.373
0.337
0.308
0.266
Upper Range,
D4
3.268
2.574
2.282
2.115
2.004
1.924
1.864
1.816
1.777
1.716
Lower Range,
D3
0
0
0
0
0
0.076
0.136
0.184
0.223
0.284

Transcribed Image Text:Twelve samples, each containing five parts, were taken from a process that produces steel rods at Emmanual Kodzi's factory. The length of each rod in the samples was determined. The results
were tabulated and sample means and ranges were computed. The results were:
Sample
1
2
3
4
5
6
Sample
Mean (in.)
8.900
8.902
8.889
8.908
8.899
8.897
Range (in.) Sample Sample Mean (in.) Range (in.)
7
8.903
8
8.907
9
8.895
10
8.903
11
8.901
12
8.906
For the given data, the x = 8.9008 inches (round your response to four decimal places).
Based on the sampling done, the control limits for 3-sigma x chart are:
Upper Control Limit (UCL) = inches (round your response to four decimal places).
0.033
0.041
0.034
0.051
0.031
0.036
0.041
0.034
0.027
0.029
0.039
0.047
Expert Solution
This question has been solved!
Explore an expertly crafted, step-by-step solution for a thorough understanding of key concepts.

Step by stepSolved in 4 steps with 12 images

Knowledge Booster

Similar questions
- To determine if their 1.50 inch steel handles are properly adjusted, Smith & Johnson Industries has decided to use an X-Chart which uses the range to estimate the variability in the sample. AnswerHow Step 3 of 7: What is the Lower Control Limit? Round your answer to three decimal places. Period obs1 obs2 obs3 obs4 obs5 1 1.46 1.50 1.46 1.53 1.55 1.54 1.45 1.50 1.54 1.52 1.49 1.53 1.47 1.51 1.47 1.49 1.53 5 1.54 1.50 1.47 1.46 1.54 1.53 1.46 1.51 1.52 1.49 1.46 1.55 1.45 1.47 1.53 1.53 1.50 1.52 1.45 1.49 1.53 1.48 1.53 1.47 1.49 JAWN - Select the Copy Table button to copy all values. To select an entire row or column, either click on the row or column header or use the S and arrow keys. To find the average of the selected cells, select the Average Values button. Copy Table Average Values The average of the selected cell(s) is 1.460. Copy Value 2 3 4 6789 22 10 1.49 11 1.52 1.52 O Control Chart 12 Table obs6 1.54 1.46 1.52 1.47 1.45 1.50 1.53 1.46 1.45 1.49 1.51 1.52 1.51 1.50 1.47 1.54…arrow_forwardWhen computing a 95% CI for a population mean, the ____ is used as the point estimate. Sample Mean SEM UB or LB T-value for the middle 95% of all possible t-valuesarrow_forwardYou have been hired by Ford Motor Company to do market research and you must estimate the percentage of households in which a vehicle is owned. How many households must you survey if you want to be 94% confident that your sample percentage has a margin of error within 0.03?arrow_forward
- Cumulative frequency Male Beagles 50- 45- 40- 35- 30- 25- 20- 15- 10- 5- 0- 19.5 22.5 25.5 28.5 31.5 34.5 Weight (in pounds) 55-arrow_forwardCalculate the proportion of the 100 samples that had at least five people own a dog. Round your answer to four decimal places. population is unknown p= .5967 n= 100arrow_forwardwhat is your SAT score if scored in the 95th percentile? mean:1000 standard Deviation: 250arrow_forward
- You want to use a sample size such that about 95% of the averages fall within 12 minutes of the population mean for average sleep time (in hours). The population standard deviation for sleep time is 1.68 hours. What is the smallest sample size required?arrow_forwardCalculate the upper bound of a 95% interval for the sample proportion for the given data (round your answer to 4 decimal places): Population proportion = 70% Number of people from sample who said they play video games = 42 Sample size = 50arrow_forwardCalculate the 95% margin of error in estimating a population mean for the following values. (Round your answer to three decimal places.) 30,² = 1.2 n =arrow_forward
arrow_back_ios
SEE MORE QUESTIONS
arrow_forward_ios
Recommended textbooks for you
- MATLAB: An Introduction with ApplicationsStatisticsISBN:9781119256830Author:Amos GilatPublisher:John Wiley & Sons Inc
 Probability and Statistics for Engineering and th...StatisticsISBN:9781305251809Author:Jay L. DevorePublisher:Cengage Learning
 Statistics for The Behavioral Sciences (MindTap C...StatisticsISBN:9781305504912Author:Frederick J Gravetter, Larry B. WallnauPublisher:Cengage Learning
  Elementary Statistics: Picturing the World (7th E...StatisticsISBN:9780134683416Author:Ron Larson, Betsy FarberPublisher:PEARSON
 The Basic Practice of StatisticsStatisticsISBN:9781319042578Author:David S. Moore, William I. Notz, Michael A. FlignerPublisher:W. H. Freeman
 Introduction to the Practice of StatisticsStatisticsISBN:9781319013387Author:David S. Moore, George P. McCabe, Bruce A. CraigPublisher:W. H. Freeman
MATLAB: An Introduction with Applications
Statistics
ISBN:9781119256830
Author:Amos Gilat
Publisher:John Wiley & Sons Inc
Probability and Statistics for Engineering and th...
Statistics
ISBN:9781305251809
Author:Jay L. Devore
Publisher:Cengage Learning
Statistics for The Behavioral Sciences (MindTap C...
Statistics
ISBN:9781305504912
Author:Frederick J Gravetter, Larry B. Wallnau
Publisher:Cengage Learning
Elementary Statistics: Picturing the World (7th E...
Statistics
ISBN:9780134683416
Author:Ron Larson, Betsy Farber
Publisher:PEARSON
The Basic Practice of Statistics
Statistics
ISBN:9781319042578
Author:David S. Moore, William I. Notz, Michael A. Fligner
Publisher:W. H. Freeman
Introduction to the Practice of Statistics
Statistics
ISBN:9781319013387
Author:David S. Moore, George P. McCabe, Bruce A. Craig
Publisher:W. H. Freeman