Concept explainers
A suburban hotel derives its revenue from its hotel and restaurant operations. The owners are interested in the relationship between the number of rooms occupied on a nightly basis and the revenue per day in the restaurant. Below is a sample of 25 days (Monday through Thursday) from last year showing the restaurant income and number of rooms occupied.
| Day | Revenue | Occupied | Day | Revenue | Occupied | ||||||||
| 1 | $ | 1,452 | 23 | 14 | $ | 1,425 | 27 | ||||||
| 2 | 1,361 | 47 | 15 | 1,445 | 34 | ||||||||
| 3 | 1,426 | 21 | 16 | 1,439 | 15 | ||||||||
| 4 | 1,470 | 39 | 17 | 1,348 | 19 | ||||||||
| 5 | 1,456 | 37 | 18 | 1,450 | 38 | ||||||||
| 6 | 1,430 | 29 | 19 | 1,431 | 44 | ||||||||
| 7 | 1,354 | 23 | 20 | 1,446 | 47 | ||||||||
| 8 | 1,442 | 44 | 21 | 1,485 | 43 | ||||||||
| 9 | 1,394 | 45 | 22 | 1,405 | 38 | ||||||||
| 10 | 1,459 | 16 | 23 | 1,461 | 51 | ||||||||
| 11 | 1,399 | 30 | 24 | 1,490 | 61 | ||||||||
| 12 | 1,458 | 42 | 25 | 1,426 | 39 | ||||||||
| 13 | 1,537 | 54 | |||||||||||
Click here for the Excel Data File
-
Choose the
scatter diagram that best fits the data. - Determine the coefficient of
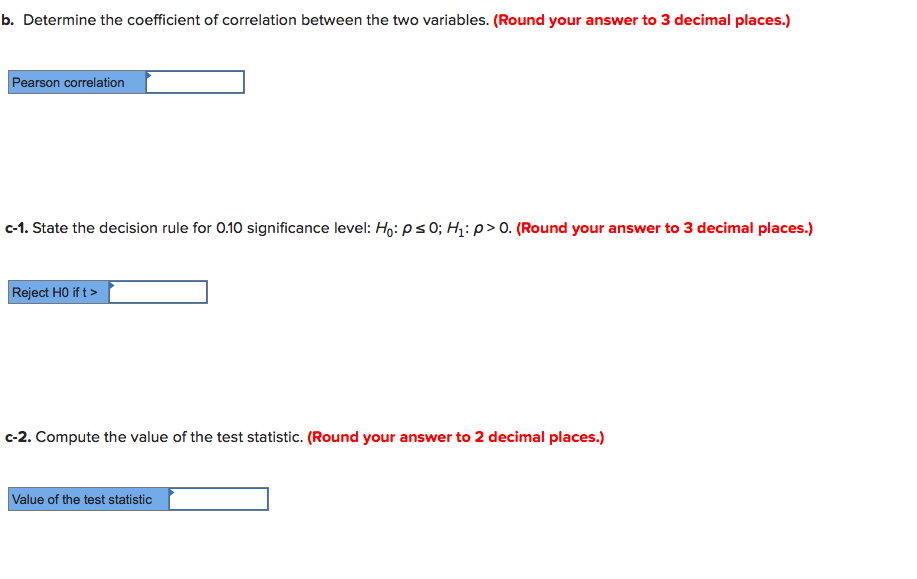
correlation between the two variables. (Round your answer to 3 decimal places.) -
c-1. State the decision rule for 0.10 significance level: H0: ρ ≤ 0; H1: ρ > 0. (Round your answer to 3 decimal places.)
-
c-2. Compute the value of the test statistic. (Round your answer to 2 decimal places.)
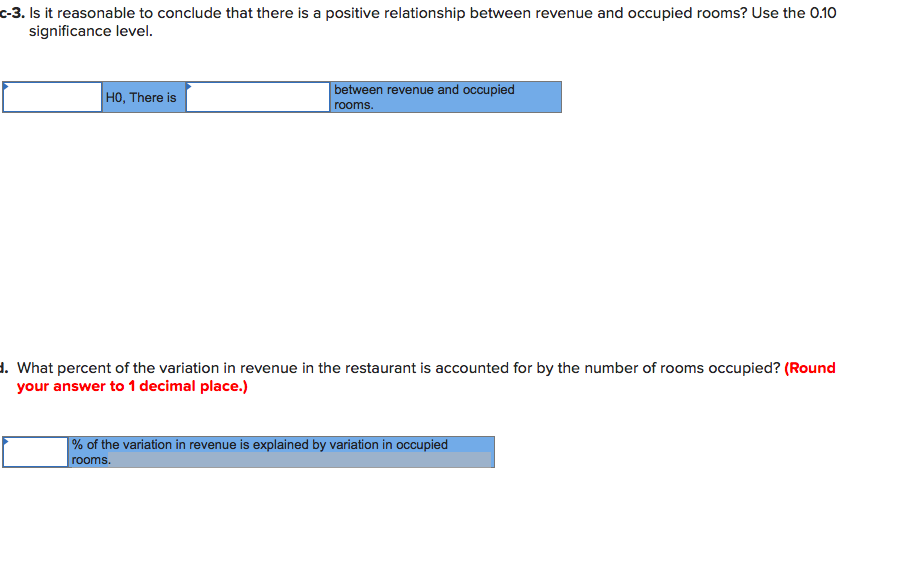
- Is it reasonable to conclude that there is a positive relationship between revenue and occupied rooms? Use the 0.10 significance level.
-
What percent of the variation in revenue in the restaurant is accounted for by the number of rooms occupied? (Round your answer to 1 decimal place.)


Trending nowThis is a popular solution!
Step by stepSolved in 6 steps with 7 images

- The following table shows the median income, in thousands of dollars, of American families for 2003 through 2008. Year 2003 2004 Income (thousands of dollars) 52.68 54.06 2005 56.19 2006 58.41 2007 2008 61.36 61.52 (a) Plot the data. H H 62 62 61 61 60 60 59 59 58 58 57 57 56 56 55 55 54 54 53 53 2004 2005 2006 2007 2008 2004 2005 2006 2007 2008 H H. 62 62 61 61 60 60 59 59 58 58 57 57 56 56 55 55 54 54 53 53 2004 2005 2006 2007 2008 2004 2005 2006 2007 2008 (b) Use exponential regression to construct an exponential model for the income data. (Let t be years since 2003 and H be the median household income in thousand of dollars.) OH = 62.520 x 0.967 OH = 57.370 x 1.010 OH = 71.932 x 0.856 OH = 49.035 x 1.245 O H = 52.587 x 1.035 (c) What was the yearly percentage growth rate in median family income during this period? (Use the model found in part (b). Round your answer to one decimal place.)arrow_forwardmpute Marshall – Edgeworth price index number for the following data by taking 2016 as base year. Items sold out in a men's wear 2017. 2016 GRSH Prices Quantity Quantity Prices Shirts 900 175 700 150 Pants 1200 150 1000 100 Sandals 600 100 500 70 Shoes 1800 60 1500 50 150 Belts Watches 400 100 600 250 300 1500 1200arrow_forwardIdentify the type of observational study (cross-sectional, retrospective, or prospective) described below. A research company uses a device to record the viewing habits of about 10,000 households, and the data collected over the next 10 years will be used to determine whether the proportion of households tuned to a particular children's program decreases. Which type of observational study is described in the problem statement? O A prospective study O A retrospective study A cross-sectional study F4 F5 F6 F7 F8 F9 DELL F10 (... F11 -O F12 O PrtScr Insert Delete PgUp 。 Next PgDn Hoarrow_forward
- Males 74 75 69 72 75 73 88 76 71 64 67 71 72 82 71 83 82 78 80 81 75 Females 75 57 61 71 79 78 81 65 57 80 73 83 86 79 65 70 69 76 55 66 79 5. Construct stem-and-leaf plots for each data set using four stems. You should have two separate plots: one for men and one for women. 6. Why is it important to have the same stems for both plots, even though one plot has an empty stem? 7. Comment on the distributions. What type on conclusions can you make about the heart rates of males and females? Do they appear to be very different?arrow_forwardThe manager of Hudson Auto Repair would like to get a better picture of the distribution of costs for new parts used in the engine tune-up jobs done in the garage. A sample of 50 customer invoices for tune-ups has been taken and the costs of parts, rounded to the nearest dollar, are listed below. 91 78 93 57 75 52 99 80 73 62 71 69 72 89 66 75 79 75 72 76 104 74 62 68 97 105 77 65 80 109 85 97 88 68 83 68 71 69 67 74 62 82 98 101 79 105 79 69 62 73 Develop a frequency distribution for these cost data. Use your own judgment to determine the number of classes and class width that provide a distribution that will be meaningful and helpful to the manager. a. Develop a stem-and-leaf display showing both the rank order and shape of the data set. (3) b. Develop a stretched stem-and-leaf display using two stems for each leading digit(s). (2) c. Which display is better at revealing the natural grouping and variation in the data? (1)arrow_forward10. Critical Thinking The following data represent salaries, in thousands of dollars, for employees of asmall company. Notice that the data have been sorted in increasing order. 24 25 25 27 27 29 30 3535 35 36 38 38 39 39 40 40 40 45 45 45 45 47 52 52 52 58 59 59 61 61 67 68 68 68 250(a) Make a histogram using the class boundaries 23.5, 69.5, 115.5, 161.5, 207.5, 253.5.(b) Look at the last data value. Does it appear to be an outlier? Could this be the owner’s salary?(c) Eliminate the high salary of 250 thousand dollars. Make a new histogram using the classboundaries 23.5, 32.5, 41.5, 50.5, 59.5, 68.5. Does this histogram refl ect the salary distribution ofmost of the employees better than the histogram in part (a)?arrow_forward
- A sales manager collected the following data on annual sales for new customer accounts and the number of years of experience for a sample of 10 salespersons. Years of Annual Sales Salesperson Experience ($1000s) 1 1 80 76 3 82 4 83 8 97 93 10 96 8 12 113 14 121 10 16 119 The data on y= annual sales ($1000s) for new customer accounts and 2 = number of years of experience for a sample of 10 salespersons provided the estimated regression equation ŷ = 68.53+3.31r. For these data 7 = 8.3, (c. I = 206.10, and s = 5.2107. %3D a. Develop the 95% confidence interval for the mean annual sales ($1000s) for all salespersons with eleven years of experience. (2$ ) (to 2 decimals) b. The company is considering hiring Tom Smart, a salesperson with eleven years of experience. Develop a 95% prediction interval of annual sales ($1000s) for Tom yegrs Smart. ($ 24 ) (to 2 decimals) c. Discuss the differences in your answers to parts (a) and (b). As expected, the prediction interval is much (narrow predict…arrow_forwardThe number of adult Americans who smoke continues to drop. The table contains estimates of the percentages of adults (ages 1818 and over) who were smokers in the years between 1965 and 201715.and 201715. ???? ?Year � ??????? ?Smokers � 1965 41.94 1970 37.4 1974 37.1 1978 34.1 1980 33.2 1983 32.1 1985 30.1 1987 28.8 1990 25.5 1993 25.0 1995 24.7 1997 24.7 1999 23.5 2001 22.8 2002 22.5 2004 20.9 2006 20.8 2008 20.6 2010 19.3 2012 18.1 2014 16.8 2017 14.0 According to your regression line, how much did smoking decline per year during this period, on the average? Give your answer to three decimal places. average smoking decline: percentage pointsarrow_forwardThe following data, taken from 8 towns in Alberta, are the percentage of residents who are university graduates and the median household incomes (in $ 1000's) for all households in each town. Graduates (%) Median Income ($ 1000) 47.6 34.1 31.5 41.3 34.5 28.1 23.1 20.4 61.7 50.9 57.1 56.4 42.8 42.1 33.2 19.2 Use two-decimal places in your answers. 4 (a) State the slope term and the Y -intercept term of the least squares regression line which attempts to predict the median income of a town in Alberta based on its linear relationship with the percentage of residents who are university graduates. (b) Find the correlation coefficient. (c) As the percenage of university graduates increases by 10%, the median income will change (in $ 1000s) by (make sure you include the positive or negative sign) (d) What percentage of the variation in the variable Median Income is not explained by its linear relationship to the variable Percentage of University Graduates? Use at least one place after the…arrow_forward
- For a particular red wine, the following data show the auction price for a 750-milliliter bottle and the age of the wine in June of 2016. Age (years) 37 20 29 33 41 26 29 45 34 22 Price ($) 256 142 217 255 331 168 209 297 237 182arrow_forwardBelow are numbers of hours that a sample of 18 recent college graduates reported working last week. 55 48 46 64 68 43 37 44 63 54 45 48 52 39 50 51 65 38 Construct a box and whisker plot for the data.arrow_forwardThe following frequency distribution gives the credit card debt of bank customers. Debt Frequency $0- $999 100 $1000 $1999 300 $2000 - $2999 1200 $3000 - $3999 1100 $4000 $4999 600 $5000 - $5999 200 Give the class boundaries. $999 O $1999.50, $2999.50, $3999.50, $4999.50 $1999.05, $2999.05, $3999.05, $4999.05 O $1000 « Previousarrow_forward
 MATLAB: An Introduction with ApplicationsStatisticsISBN:9781119256830Author:Amos GilatPublisher:John Wiley & Sons Inc
 Probability and Statistics for Engineering and th...StatisticsISBN:9781305251809Author:Jay L. DevorePublisher:Cengage Learning
 Statistics for The Behavioral Sciences (MindTap C...StatisticsISBN:9781305504912Author:Frederick J Gravetter, Larry B. WallnauPublisher:Cengage Learning
 Elementary Statistics: Picturing the World (7th E...StatisticsISBN:9780134683416Author:Ron Larson, Betsy FarberPublisher:PEARSON
 The Basic Practice of StatisticsStatisticsISBN:9781319042578Author:David S. Moore, William I. Notz, Michael A. FlignerPublisher:W. H. Freeman
 Introduction to the Practice of StatisticsStatisticsISBN:9781319013387Author:David S. Moore, George P. McCabe, Bruce A. CraigPublisher:W. H. Freeman


