MATLAB: An Introduction with Applications
6th Edition
ISBN: 9781119256830
Author: Amos Gilat
Publisher: John Wiley & Sons Inc
expand_more
expand_more
format_list_bulleted
Question
thumb_up100%

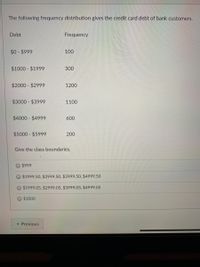
Transcribed Image Text:The following frequency distribution gives the credit card debt of bank customers.
Debt
Frequency
$0- $999
100
$1000 $1999
300
$2000 - $2999
1200
$3000 - $3999
1100
$4000 $4999
600
$5000 - $5999
200
Give the class boundaries.
$999
O $1999.50, $2999.50, $3999.50, $4999.50
$1999.05, $2999.05, $3999.05, $4999.05
O $1000
« Previous
Expert Solution
This question has been solved!
Explore an expertly crafted, step-by-step solution for a thorough understanding of key concepts.
This is a popular solution
Trending nowThis is a popular solution!
Step by stepSolved in 2 steps with 2 images

Knowledge Booster
Learn more about
Need a deep-dive on the concept behind this application? Look no further. Learn more about this topic, statistics and related others by exploring similar questions and additional content below.Similar questions
- Decide whether there is a relationship between mobile phone brands and the gender.arrow_forwardFind the mean, the median, and the mode of the following salaries of employees of the Moe D. Lawn Landscaping Company. (If an answer does not exist, enter DNE.) mean $ 31750 median $ 29500 mode $ DNE Salary Frequency $23,000 4 $29,000 3 $30,000 $45,000 1 PictureNt/Corbisarrow_forwardA data set is summarized in the frequency table below. The data set contains a total of 30 data values. What is the missing frequency? Value Frequency 1 5 2 3 3 4 4 6 5 □ 6 2 7 3 8 4arrow_forward
- A data set is summarized in the frequency table below. The data set contains a total of 50 data values. What is the missing frequency? Value Frequency 2 7 3 4 4 3 5 ◻ 6 5 7 7 8 4 9 7 0 5arrow_forwardThe HR group for a company collected data detailing the educational level of the company's employees. They found that 155 have no degree (None), 47 have an associate's degree (AA), 213 have a bachelor's degree (BA), 49 have a master's degree (MA), and 33 have PhDs. A frequency/relative frequency table is shown below. Complete parts a through c below. Level Frequency Relative Frequency None AA BA MA PhD 155 47 213 49 33 31.19% 9.46% 42.86% 9.86% 6.64% a) Make a bar chart using counts on the y-axis. Choose the correct bar chart below. OA. OB. Oc. 250 500- 250- 200- 400- 200- 150- 300어 150- 100에 200- 100- 50- 100- 50- 0- None AA BA MA PhD None AA BA MA PhD "None AA BA MA PhD b) Make a relative frequency bar chart using percentages on the y-axis. Choose the correct bar chart below. O A. OB. Oc. 100- 50- 250, 200- 80- 40- 60- 150- 30- 40- 100- 20- 20어 50- 10- UNone AA RA MA Phn None AA RA MA Phn None AA RA MA Ph0arrow_forwardThe figure below presents a boxplot for athlete ages in two Olympic sports: Diving Men's Springboard and Diving Women's Platform. What is the interquartile range for athlete ages in Diving Women's Platform? Age 35- 34- 33- 32- 31- 30- 29 28- 27- 26- 25- 24- 23- 22- 21- 20- 19- 18- 17- 16- 15- 14- 13- 12- 25 021 07 O 18 Event Event Diving Men's Springboard Diving Women's Platformarrow_forward
arrow_back_ios
arrow_forward_ios
Recommended textbooks for you
 MATLAB: An Introduction with ApplicationsStatisticsISBN:9781119256830Author:Amos GilatPublisher:John Wiley & Sons Inc
 Probability and Statistics for Engineering and th...StatisticsISBN:9781305251809Author:Jay L. DevorePublisher:Cengage Learning
 Statistics for The Behavioral Sciences (MindTap C...StatisticsISBN:9781305504912Author:Frederick J Gravetter, Larry B. WallnauPublisher:Cengage Learning
 Elementary Statistics: Picturing the World (7th E...StatisticsISBN:9780134683416Author:Ron Larson, Betsy FarberPublisher:PEARSON
 The Basic Practice of StatisticsStatisticsISBN:9781319042578Author:David S. Moore, William I. Notz, Michael A. FlignerPublisher:W. H. Freeman
 Introduction to the Practice of StatisticsStatisticsISBN:9781319013387Author:David S. Moore, George P. McCabe, Bruce A. CraigPublisher:W. H. Freeman

MATLAB: An Introduction with Applications
Statistics
ISBN:9781119256830
Author:Amos Gilat
Publisher:John Wiley & Sons Inc

Probability and Statistics for Engineering and th...
Statistics
ISBN:9781305251809
Author:Jay L. Devore
Publisher:Cengage Learning

Statistics for The Behavioral Sciences (MindTap C...
Statistics
ISBN:9781305504912
Author:Frederick J Gravetter, Larry B. Wallnau
Publisher:Cengage Learning

Elementary Statistics: Picturing the World (7th E...
Statistics
ISBN:9780134683416
Author:Ron Larson, Betsy Farber
Publisher:PEARSON

The Basic Practice of Statistics
Statistics
ISBN:9781319042578
Author:David S. Moore, William I. Notz, Michael A. Fligner
Publisher:W. H. Freeman

Introduction to the Practice of Statistics
Statistics
ISBN:9781319013387
Author:David S. Moore, George P. McCabe, Bruce A. Craig
Publisher:W. H. Freeman