
MATLAB: An Introduction with Applications
6th Edition
ISBN: 9781119256830
Author: Amos Gilat
Publisher: John Wiley & Sons Inc
expand_more
expand_more
format_list_bulleted
Related questions
Question
thumb_up100%
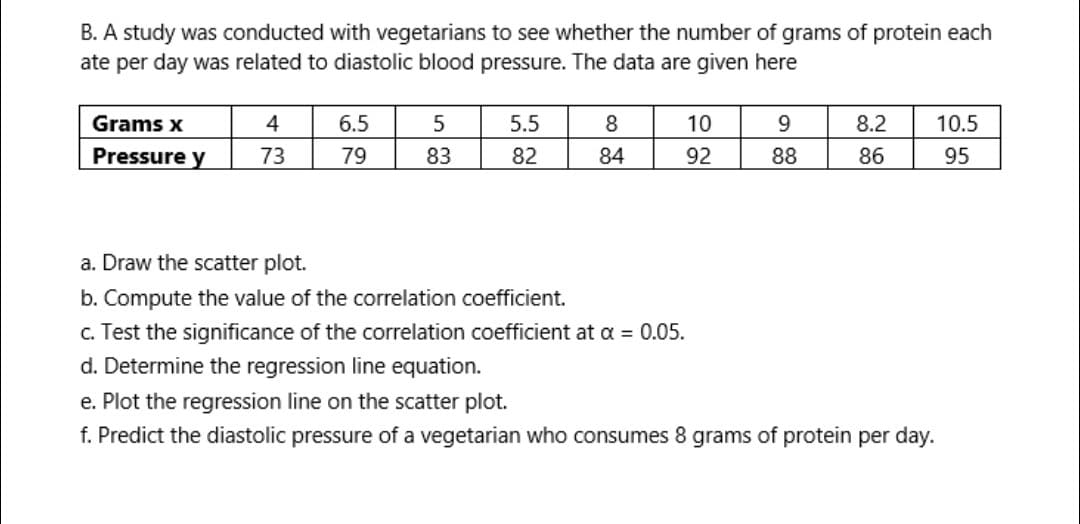

Transcribed Image Text:B. A study was conducted with vegetarians to see whether the number of grams of protein each
ate per day was related to diastolic blood pressure. The data are given here
Grams x
4
6.5
5.5
8
10
9.
8.2
10.5
Pressure y
73
79
83
82
84
92
88
86
95
a. Draw the scatter plot.
b. Compute the value of the correlation coefficient.
c. Test the significance of the correlation coefficient at a = 0.05.
d. Determine the regression line equation.
e. Plot the regression line on the scatter plot.
f. Predict the diastolic pressure of a vegetarian who consumes 8 grams of protein per day.
Expert Solution
This question has been solved!
Explore an expertly crafted, step-by-step solution for a thorough understanding of key concepts.

This is a popular solution

Trending nowThis is a popular solution!

Step by stepSolved in 3 steps with 5 images

Knowledge Booster

Similar questions
- A biologist looked at the relationship between number of seeds a plant produces and the percent of those seeds that sprout. The results of the survey are shown below. Seeds Produced Sprout Percent 45.5 65 53 62 48 44 65.5 51 58 66 42 64 62 56 Round to 2 decimal places. Find the correlation coefficient: r = The null and alternative hypotheses for correlation are: Ho: ? = 0 H₁: ? 0 The p-value is: (Round to four decimal places) Use a level of significance of a = 0.05 to state the conclusion of the hypothesis test in the context of the study. O There is statistically insignificant evidence to conclude that there is a correlation between the number of seeds that a plant produces and the percent of the seeds that sprout. Thus, the use of the regression line is not appropriate. There is statistically significant evidence to conclude that a plant that produces more seeds will have seeds with a lower sprout rate than a plant that produces fewer seeds. O There is statistically insignificant…arrow_forwardA grocery store manager did a study to look at the relationship between the amount of time (in minutes) customers spend in the store and the amount of money (in dollars) they spend. The results of the survey are shown below. Time 21 19 23 25 17 12 19 Money 106 80 87 96 80 39 92 a. Find the correlation coefficient: r = Round to 2 decimal places. b. The null and alternative hypotheses for correlation are: Họ: ? H1: ? v + O The p-value is: (Round to four decimal places) c. Use a level of significance of a = 0.05 to state the conclusion of the hypothesis test in the context of the study. O There is statistically insignificant evidence to conclude that a customer who spends more time at the store will spend more money than a customer who spends less time at the store. O There is statistically significant evidence to conclude that there is a correlation between the amount of time customers spend at the store and the amount of money that they spend at the store. Thus, the regression line is…arrow_forwardI only need help with the blank boxes to be filled with the answer.arrow_forward
- The scatter plot above displays data on the number of defects per 100 cars and a measure of customer satisfaction (on a scale from 1 to 1000, with the highest scores indicating greater satisfaction) for the 33 brands of cars sold in the United States in 2009. Which of the following is the value of the correlation coefficient for this data set? A) r = -0.95 B) r = -0.24 C) r = 0.83 D) r = 1.00arrow_forwardI AM RESUBMITTING THIS QUESTION FOR MORE SUBPARTS. I NEED HELP FROM NUMBER 7 DOWN. THANK YOU. A grocery store manager did a study to look at the relationship between the amount of time (in minutes) customers spend in the store and the amount of money (in dollars) they spend. The results of the survey are shown below. Time 27 22 17 30 17 19 12 23 22 Money 117 72 53 106 66 93 53 83 95 Find the correlation coefficient: r= Round to 2 decimal places. The null and alternative hypotheses for correlation are:H0:H0: ? μ r ρ == 0H1:H1: ? r ρ μ ≠≠ 0 The p-value is: (Round to four decimal places) Use a level of significance of α=0.05α=0.05 to state the conclusion of the hypothesis test in the context of the study. There is statistically significant evidence to conclude that a customer who spends more time at the store will spend more money than a customer who spends less time at the store. There is statistically significant evidence to conclude that there is a…arrow_forwardThe data below is how much money an ice cream store makes and what the max temperature was at that day. Test the claim that there is no correlation between the two. Use a significance of .05. Temp Dollars (Farenheit) made 81 4145 91 3342 98 4180 105 5121 84 2480 89 3011 94 3630 86 2777 95 3914 103 4798 91 4702 立arrow_forward
arrow_back_ios
arrow_forward_ios
Recommended textbooks for you
- MATLAB: An Introduction with ApplicationsStatisticsISBN:9781119256830Author:Amos GilatPublisher:John Wiley & Sons Inc
 Probability and Statistics for Engineering and th...StatisticsISBN:9781305251809Author:Jay L. DevorePublisher:Cengage Learning
 Statistics for The Behavioral Sciences (MindTap C...StatisticsISBN:9781305504912Author:Frederick J Gravetter, Larry B. WallnauPublisher:Cengage Learning
  Elementary Statistics: Picturing the World (7th E...StatisticsISBN:9780134683416Author:Ron Larson, Betsy FarberPublisher:PEARSON
 The Basic Practice of StatisticsStatisticsISBN:9781319042578Author:David S. Moore, William I. Notz, Michael A. FlignerPublisher:W. H. Freeman
 Introduction to the Practice of StatisticsStatisticsISBN:9781319013387Author:David S. Moore, George P. McCabe, Bruce A. CraigPublisher:W. H. Freeman
MATLAB: An Introduction with Applications
Statistics
ISBN:9781119256830
Author:Amos Gilat
Publisher:John Wiley & Sons Inc
Probability and Statistics for Engineering and th...
Statistics
ISBN:9781305251809
Author:Jay L. Devore
Publisher:Cengage Learning
Statistics for The Behavioral Sciences (MindTap C...
Statistics
ISBN:9781305504912
Author:Frederick J Gravetter, Larry B. Wallnau
Publisher:Cengage Learning
Elementary Statistics: Picturing the World (7th E...
Statistics
ISBN:9780134683416
Author:Ron Larson, Betsy Farber
Publisher:PEARSON
The Basic Practice of Statistics
Statistics
ISBN:9781319042578
Author:David S. Moore, William I. Notz, Michael A. Fligner
Publisher:W. H. Freeman
Introduction to the Practice of Statistics
Statistics
ISBN:9781319013387
Author:David S. Moore, George P. McCabe, Bruce A. Craig
Publisher:W. H. Freeman