At the end of this specific task, students should be able to:
• Create and work with Loops
• Handle and manipulate strings
• (Learning Units 4 and 5).
It is good practice to leave your main branch as your long live branch, this means that the code on
this branch is always in perfect working order and tested. We make use of feature branches in
order to ensure that any code we push to GitHub does not break our main branch. You can create
a feature branch by running the following command.
git checkout -b KhanbanTasks (you can use any branch name)
** You are welcome to make use of GitHub desktop or your IDE to push code to GitHub if you
are not comfortable with using the command line.
You can now add the following functionality to your application:
1. The users should only be able to add tasks to the application if they have logged in
successfully.
2. The applications must display the following welcome message: “Welcome to EasyKanban”.
3. The user should then be able to choose one of the following features from a numeric menu:
a. Option 1) Add tasks
21; 22; 23 2022
b. Option 2) Show report - this feature is still in development and should display the
following message: “Coming Soon”.
c. Option 3) Quit
4. The application should run until the users selects quit to exit.
5. Users should define how many tasks they wish to enter when the application starts, the
application should allow the user to enter only the set number of tasks.
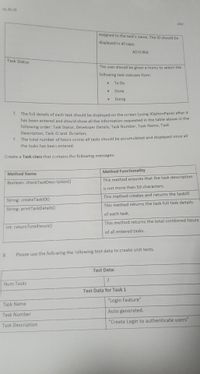
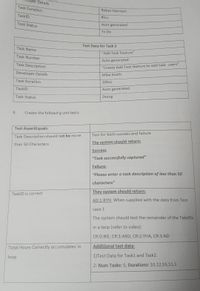
6. Each task should contain the following information:


Step by stepSolved in 2 steps

hi, do you have any tips on how to call this into the main method of the code ?
hi, do you have any tips on how to call this into the main method of the code ?
- Final help needed for Python Turtle, does my code have everything required, and if not can you help make the changes needed. 1. An additional option to generate another island if the user does not like the one they have (loops until they are satisfied) and have the GUIs bigger.2. Does my code have two or more functions (I dont know if the drawing only counts as one)?3. Does my code have atleast one list, dictionary, or set (if not reorganize/add one)?4. Need help exporting the finished turtle image into a file on desktop (yes/no option input by user) that can be accessed, or png (In ###'s I saved the broken code that i dont know how to fix) My code: import turtleimport randomimport tkinter as tkfrom tkinter import simpledialog### OPTIONAL IMAGE CONVERTER, REMOVE ###'S TO USE###from PIL import Image# Colors:ocean = "#000066"sand = "#ffff66"grass = "#00cc00"lake = "#000066"mountain_color = "#808080" mountain_positions = []def draw_irregular_circle(radius, line_color, fill_color,…arrow_forwardPlease see the snip for the detail. Note: The polygon have to rotate clockwise in same also counterclock wise have to rotate: here is my code it have issue it only rotate to clockwise but in same time have to rotate to the counterclockwise too but it not plesase fix it or write from new. my code: import turtle as t import math class CenteredPolygon: def __init__(self, n, size, center=(0, 0), pen=None, **kwargs): self.numsides = n self.size = size self.center = center self.corners = [] self.pen = pen if pen is not None else self.init_pen(**kwargs) self.draw() def init_pen(self, **kwargs): pen = t.Turtle() for key, value in kwargs.items(): try: f = getattr(pen, key) f(value) except Exception as e: print(e) return pen def set_corners(self) -> list: p = self.pen p.pu() p.goto(self.center) for i…arrow_forwardastfoodStats Assignment Description For this assignment, name your R file fastfoodStats.R For all questions you should load tidyverse, openintro, and lm.beta. You should not need to use any other libraries. suppressPackageStartupMessages(library(tidyverse)) suppressPackageStartupMessages(library(openintro)) suppressPackageStartupMessages(library(lm.beta)) The actual data set is called fastfood. Continue to use %>% for the pipe. CodeGrade does not support the new pipe. Round all float/dbl values to two decimal places. All statistics should be run with variables in the order I state E.g., "Run a regression predicting mileage from mpg, make, and type" would be: lm(mileage ~ mpg + make + type...) To access the fastfood data, run the following: fastfood <- openintro::fastfood Create a correlation matrix for the relations between calories, total_fat, sugar, and calcium for all items at Sonic, Subway, and Taco Bell, omitting missing values with na.omit(). Assign the…arrow_forward
- ModalProp detailsanimationType it's an enum of ('none', 'slide', 'fade') and it controls modal animation.visible its a bool that controls modal visiblity.onShow it allows passing a function that will be called once the modal has been shown.transparent bool to set transparency.onRequestClose (android) it always defining a method that will be called when user tabs back buttononOrientationChange (IOS) it always defining a method that will be called when orientation changessupportedOrientations (IOS) enum('portrait', 'portrait-upside-down', 'landscape', 'landscape-left', 'landscape-right')Modal component is a simple way to present content above an enclosing view.using given Modal make a Basic Example?arrow_forwardI'm interested in creating a digital personal assistant similar to Alexa and Siri, which can efficiently manage schedules. Specifically, I want to design a tool in Java that allows users to find events during a certain time period. This tool should also enable users to add and cancel events as their schedules change. To achieve this, I plan to use a SkipListMap class with specific operations (get, put, remove, subMap) and a DoublyLinkedList class. Additionally, I'll use the FakeRandomHeight class for debugging and testing. Could you provide guidance on how to approach this project, especially in terms of implementing the SkipListMap class and managing event data efficiently? Sample Input: AddEvent 101910 BreakfastAddEvent 101913 LunchAddEvent 101918 DinnerGetEvent 101914AddEvent 101911 Data StructuresAddEvent 102007 ExercisePrintSkipListAddEvent 101915 HomeworkCancelEvent 102007AddEvent 102013 RelaxAddEvent 102011 Read a BookGetEvent 101915AddEvent 101914 Call MomPrintSkipList I…arrow_forwardAnother functionality for the app is the ability to estimate the return on investment over a period of time. In order to implement this feature, you will have to update the investment calculator algorithm. The base function to calculate the return on investment from Task 1 can be reutilized here to simplify our task. This feature will take into consideration a 12-month period by default. To calculate the total amount earned over a period of time, you will have to loop through the n-months period, increase the amount for each period. The other rules from the previous task apply here as well. For example: If you invest $3 million on the first month, and obtain a return of $93,000 dollars, then the amount to be invested in the second month is $3.093 million. To summarize: Loop over a period of 12 months to calculate the total for each period Return the accumulated estimated value for a period of 12 monthsarrow_forward
- Javascript Use a for/of loop to iterate over the array of students. For each student, use a template literal to print out their name, age, and major in a formatted string. (e.g. John is 18 years old and is studying Computer Science.) Within the template literal, use object dot notation to access the name, age, and major properties of the student object. Use a console.log() to print out the formatted string for each student. Test the code by running it and verifying that it prints out the details of each student in a formatted string.============================================================================== const students = [ { name: "John", age: 18, major: "Computer Science" }, { name: "Newton", age: 19, major: "Mathematics" }, { name: "Barry", age: 20, major: "Physics" }, ]; // Iterate through the array of objects students using for/of // Print a message to the console that includes the student's name, age, and major // Example: John is 18 years old and…arrow_forwardburses.projectstem.org/courses/64525/assignments/9460863?module_item_id=18079077 Maps HH 50 Follow these steps to create your Warhol Grid: 1. Find or create an image (for this activity, a smaller starting image will produce higher quality results in a shorter amount of time). 2. Using the Python documentation as a guide, create a program that loads the image, filters three copies of it, and saves the result. Note: You will need to create the three filters using the filter() method. • Include multiple filters on at least two of your variants. One of your variants must apply a single filter multiple times with the use of a loop. For example, the top right image above uses a loop to blur the image 2 times (what if we did it 100 times?). U ▪ One of your images must apply at least two different filters to the same image. In the example image, the bottom right image includes a filter to smooth the image and then edge enhance them. L • Create the Warhol Grid using Python with the three images…arrow_forward
 Computer Networking: A Top-Down Approach (7th Edi...Computer EngineeringISBN:9780133594140Author:James Kurose, Keith RossPublisher:PEARSON
 Computer Organization and Design MIPS Edition, Fi...Computer EngineeringISBN:9780124077263Author:David A. Patterson, John L. HennessyPublisher:Elsevier Science
 Network+ Guide to Networks (MindTap Course List)Computer EngineeringISBN:9781337569330Author:Jill West, Tamara Dean, Jean AndrewsPublisher:Cengage Learning
 Concepts of Database ManagementComputer EngineeringISBN:9781337093422Author:Joy L. Starks, Philip J. Pratt, Mary Z. LastPublisher:Cengage Learning
 Prelude to ProgrammingComputer EngineeringISBN:9780133750423Author:VENIT, StewartPublisher:Pearson Education
 Sc Business Data Communications and Networking, T...Computer EngineeringISBN:9781119368830Author:FITZGERALDPublisher:WILEY


