
MATLAB: An Introduction with Applications
6th Edition
ISBN: 9781119256830
Author: Amos Gilat
Publisher: John Wiley & Sons Inc
expand_more
expand_more
format_list_bulleted
Related questions
Question
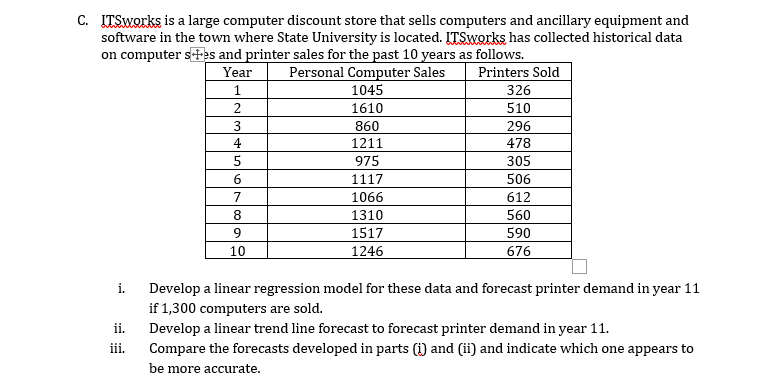

Transcribed Image Text:C. ITSworks is a large computer discount store that sells computers and ancillary equipment and
software in the town where State University is located. LTSworks has collected historical data
on computer s+es and printer sales for the past 10 years as follows.
Personal Computer Sales
1045
Year
Printers Sold
1
326
1610
510
860
296
478
4
1211
975
305
6.
1117
506
7
1066
612
8.
1310
560
1517
590
10
1246
676
i.
Develop a linear regression model for these data and forecast printer demand in year 11
if 1,300 computers are sold.
ii.
Develop a linear trend line forecast to forecast printer demand in year 11.
iii.
Compare the forecasts developed in parts (i) and (ii) and indicate which one appears to
be more accurate.
Expert Solution
This question has been solved!
Explore an expertly crafted, step-by-step solution for a thorough understanding of key concepts.

Step by stepSolved in 3 steps with 3 images

Knowledge Booster

Similar questions
- Solve the attached question and give final answers please.The question and historical data is attached.arrow_forwardA recent report stated that in 1990, there were approximately 9.7 million employment opportunities in a Science, Technology, Engineering or Mathematics (STEM) related field. There is a reported 17.3 million positions available in a STEM related field in 2019. What is the relative change in the number of STEM positions available from 1990 to 2019? A. 7.6% B. 56.1% C. 43.9% D. 78.4%arrow_forwardThe National Safety Board wants to determine the effect of seat belt use on saving lives. One study showed data on children under the age of 5 who were involved in car accidents in which at least one fatality occurred. Below is the table: X1 Survivors (0) Fatalities (1) Total No belt (0) Adult belt (1) Child seat (2) 1129 509 1638 X2 432 73 505 733 139 872 Total 2294 721 3015 Answer in 2 decimal places. a) Determine the probability that a child will be in a child seat. b) Determine the probability that X1 = 0 given X2 = 0 c) What is the probability of X1 = 1 given X2 = 0?arrow_forward
- All Greens is a franchise store that sells house plants and lawn and garden supplies. Although All Greens is a franchise, each store is owned and managed by private individuals. Some friends have asked you to go into business with them to open a new All Greens store in the suburbs of San Diego. The national franchise headquarters sent you the following information at your request. These data are about 27 All Greens stores in California. Each of the 27 stores has been doing very well, and you would like to use the information to help set up your own new store. The variables for which we have data are detailed below. x1 = annual net sales, in thousands of dollarsx2 = number of square feet of floor display in store, in thousands of square feetx3 = value of store inventory, in thousands of dollarsx4 = amount spent on local advertising, in thousands of dollarsx5 = size of sales district, in thousands of familiesx6 = number of competing or similar stores in sales district A sales district…arrow_forwardIn a study, researchers wanted to measure the effect of alcohol on the hippocampal region, the portion of the brain responsible for long-term memory storage, in adolescents. The researchers randomly selected 23 adolescents with alcohol use disorders to determine whether the hippocampal volumes in the alcoholic adolescents were less than the normal volume of 9.02 cm. An analysis of the sample data revealed that the hippocampal volume is approximately normal with no outliers and x 8.18 cm and s=0.8 cm. Conduct the appropriate test at the a= 0.01 level of significance. State the null and alternative hypotheses. Ho: H H1: (Type integers or decimals. Do not round.) Identify the t-statistic. to = (Round to two decimal places as needed.) !! Identify the P-value. P-value = (Round to three decimal places as needed.) Make a conclusion regarding the hypothesis. the null hypothesis. There sufficient evidence to claim that the mean hippocampal volume is cm³ Statcrunch Next 8:01 SAMSUNG esc @ %23 $…arrow_forwardThe table shows the leading causes of death in a certain country in a recent year. The population of the country was 311311 million. If you lived in a typical city of 500,000, how many people would you expect to die of cancercancer each year? Cause Deaths Cause Deaths Heart disease 596 comma 700596,700 Alzheimer's disease 84 comma 90084,900 Cancer 575 comma 300575,300 Diabetes 73 comma 40073,400 Chronic respiratory diseases 143 comma 100143,100 Pneumonia/Influenza 53 comma 40053,400 Stroke 128 comma 600128,600 Kidney disease 45 comma 30045,300 Accidents 122 comma 500122,500 Suicide 38 comma 60038,600 About people would be expected to die of cancer each year. (Type a whole number. Round to the nearest person as needed.)arrow_forward
arrow_back_ios
arrow_forward_ios
Recommended textbooks for you
- MATLAB: An Introduction with ApplicationsStatisticsISBN:9781119256830Author:Amos GilatPublisher:John Wiley & Sons Inc
 Probability and Statistics for Engineering and th...StatisticsISBN:9781305251809Author:Jay L. DevorePublisher:Cengage Learning
 Statistics for The Behavioral Sciences (MindTap C...StatisticsISBN:9781305504912Author:Frederick J Gravetter, Larry B. WallnauPublisher:Cengage Learning
  Elementary Statistics: Picturing the World (7th E...StatisticsISBN:9780134683416Author:Ron Larson, Betsy FarberPublisher:PEARSON
 The Basic Practice of StatisticsStatisticsISBN:9781319042578Author:David S. Moore, William I. Notz, Michael A. FlignerPublisher:W. H. Freeman
 Introduction to the Practice of StatisticsStatisticsISBN:9781319013387Author:David S. Moore, George P. McCabe, Bruce A. CraigPublisher:W. H. Freeman
MATLAB: An Introduction with Applications
Statistics
ISBN:9781119256830
Author:Amos Gilat
Publisher:John Wiley & Sons Inc
Probability and Statistics for Engineering and th...
Statistics
ISBN:9781305251809
Author:Jay L. Devore
Publisher:Cengage Learning
Statistics for The Behavioral Sciences (MindTap C...
Statistics
ISBN:9781305504912
Author:Frederick J Gravetter, Larry B. Wallnau
Publisher:Cengage Learning
Elementary Statistics: Picturing the World (7th E...
Statistics
ISBN:9780134683416
Author:Ron Larson, Betsy Farber
Publisher:PEARSON
The Basic Practice of Statistics
Statistics
ISBN:9781319042578
Author:David S. Moore, William I. Notz, Michael A. Fligner
Publisher:W. H. Freeman
Introduction to the Practice of Statistics
Statistics
ISBN:9781319013387
Author:David S. Moore, George P. McCabe, Bruce A. Craig
Publisher:W. H. Freeman