MATLAB: An Introduction with Applications
6th Edition
ISBN: 9781119256830
Author: Amos Gilat
Publisher: John Wiley & Sons Inc
expand_more
expand_more
format_list_bulleted
Question
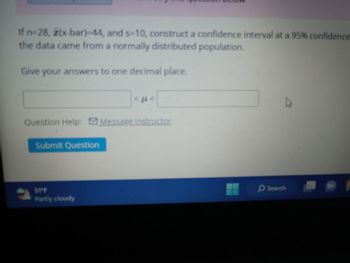
If n=28, x(x-bar)=44, and s=10, construct a confidence interval at a 95% confidence level. Assume the data came from a
Give your answers to one decimal place.

Transcribed Image Text:If n=28, z(x-bar)-44, and s-10, construct a confidence interval at a 95% confidence
the data came from a normally distributed population.
Give your answers to one decimal place.
Question Help: Message instructor
2
Submit Question
<ft<
S1°F
Partly cloudy
▷
Search
Expert Solution
This question has been solved!
Explore an expertly crafted, step-by-step solution for a thorough understanding of key concepts.
Step by stepSolved in 3 steps with 1 images

Knowledge Booster
Similar questions
- If n = 15, ¯xx¯ = 36, and s = 12, construct a confidence interval at a 90% confidence level. Assume the data came from a normally distributed population. Give your answers to three decimal places.arrow_forwardA Gallup survey of 2324 adults (at least 18 years old) in the U.S. found that 417 of them have donated blood in the past two years. Construct a 90% confidence interval for the population proportion of adults in the U.S. who have donated blood in the past two years. Round your answer to three decimal places. Use Z = 1.645. Use the unrounded values in Excel to find the answers to #2, #3 and #4 1. Find the sample proportion of adults in the U.S. who have donated blood in the past two years. Round your answer to three decimal places. 2. The standard error for sample proportion has a value of V 3. The margin of error has a value of 4. Construct the 90% confidence interval for adults who have donated blood in the past tarrow_forwardIf n=17, (x-bar)=48, and s=2, construct a confidence interval at a 80% confidence level. Assume the data came from a normally distributed population. Give your answers to one decimal place.arrow_forward
- Helparrow_forwardYou want to get a 90% confidence interval for the difference between the percentage of females with red hair compared to males with red hair. You sample 76 females and find 34 of them have red hair. You sample 65 males and find 33 have red hair. < p1−p2 <arrow_forwardIf n = 550 and X = 440, construct a 90% confidence interval for the population proportion, p. Give your answers to three decimals < p <arrow_forward
- If n=11, 7(x-bar)=45, and s=5, construct a confidence interval at a 95% confidence level. Assume the data came from a normally distributed population. Give your answers to one decimal place.arrow_forwardUse the Student's t distribution to find tc for a 0.95 confidence level when the sample is 29. (Round your answer to three decimal places.)arrow_forwardIf n=22, (x-bar)=34, and s=17, construct a confidence interval at a 99% confidence level. Assume the data came from a normally distributed population. Give your answers to one decimal place.arrow_forward
- Construct a 95% confidence interval of the population proportion using the given information. x=45, n=150 The lower bound is The upper bound isarrow_forwardA statistics practitioner took a random sample of 48 observations from a population whose standard deviation is 32 and computed the sample mean to be 107. Note: For each confidence interval, enter your answer in the form (LCL, UCL). You must include the parentheses and the comma between the confidence limits. A. Estimate the population mean with 95% confidence. Confidence Interval = B. Estimate the population mean with 90% confidence. Confidence Interval = C. Estimate the population mean with 99% confidence. Confidence lInterval =arrow_forward
arrow_back_ios
arrow_forward_ios
Recommended textbooks for you
 MATLAB: An Introduction with ApplicationsStatisticsISBN:9781119256830Author:Amos GilatPublisher:John Wiley & Sons Inc
 Probability and Statistics for Engineering and th...StatisticsISBN:9781305251809Author:Jay L. DevorePublisher:Cengage Learning
 Statistics for The Behavioral Sciences (MindTap C...StatisticsISBN:9781305504912Author:Frederick J Gravetter, Larry B. WallnauPublisher:Cengage Learning
 Elementary Statistics: Picturing the World (7th E...StatisticsISBN:9780134683416Author:Ron Larson, Betsy FarberPublisher:PEARSON
 The Basic Practice of StatisticsStatisticsISBN:9781319042578Author:David S. Moore, William I. Notz, Michael A. FlignerPublisher:W. H. Freeman
 Introduction to the Practice of StatisticsStatisticsISBN:9781319013387Author:David S. Moore, George P. McCabe, Bruce A. CraigPublisher:W. H. Freeman

MATLAB: An Introduction with Applications
Statistics
ISBN:9781119256830
Author:Amos Gilat
Publisher:John Wiley & Sons Inc

Probability and Statistics for Engineering and th...
Statistics
ISBN:9781305251809
Author:Jay L. Devore
Publisher:Cengage Learning

Statistics for The Behavioral Sciences (MindTap C...
Statistics
ISBN:9781305504912
Author:Frederick J Gravetter, Larry B. Wallnau
Publisher:Cengage Learning

Elementary Statistics: Picturing the World (7th E...
Statistics
ISBN:9780134683416
Author:Ron Larson, Betsy Farber
Publisher:PEARSON

The Basic Practice of Statistics
Statistics
ISBN:9781319042578
Author:David S. Moore, William I. Notz, Michael A. Fligner
Publisher:W. H. Freeman

Introduction to the Practice of Statistics
Statistics
ISBN:9781319013387
Author:David S. Moore, George P. McCabe, Bruce A. Craig
Publisher:W. H. Freeman