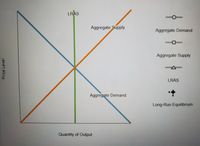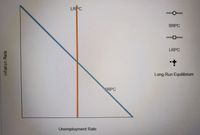
As described in the chapter, the Federal Reserve in 2008 faced a decrease in aggregate
1. Starting from a long-run equilibrium, illustrate the effects of these two changes on aggregate supply and aggregate demand on the following graph. Then, on the subsequent graph, indicate what happens on a
2. Which of the following is true as a result of the two changes in aggregate demand and aggregate supply? (Note: Do not consider the magnitudes of the shifts given on the preceding graphs. Think only about the directions of the shifts.) Check all that apply.


Trending nowThis is a popular solution!
Step by stepSolved in 2 steps with 1 images

- A) In the 1970's, the United States had slow growth and high inflation. Which kind of shock best fits these facts? - Negative real shock - Positive real shock - Negative aggregate demand shock - Positive aggregate demand shock B) Using the same categories, explain the late 1990's, when the U.S. experienced fast growth and falling inflation. C) Again using the same four categories, explain the early 2000s, when the U.S. experienced slow growth and falling inflation. D) Which shock best explains the 1981-1982 recession, when inflation fell quickly and unemployment rose quickly? E) Which shock(s) best explains the Great Recession of 2007-2008?arrow_forward1. Aggregate demand, aggregate supply, and the Phillips curve In the year 2028, aggregate demand and aggregate supply in the fictional country of Gizmet are represented by the curves AD2028 and AS on the following graph. The price level is 102. The graph also shows two possible outcomes for 2029. The first potential aggregate-demand curve is given by the ADA curve, resulting in the outcome illustrated by point A. The second potential aggregate-demand curve is given by the ADB curve, resulting in the outcome illustrated by point B. PRICE LEVEL 108 107 106 105 104 103 102 101 AS ADB AD 2028 ADA 100 0 2 4 6 8 OUTPUT (Trillions of dollars) 10 12 14 16 Suppose the unemployment rate is 6% under one of these two outcomes and 3% under the other. Based on the previous graph, you would to be associated with the lower unemployment rate (3%). expect If aggregate demand is low in 2029, and the economy is at outcome A, the inflation rate between 2028 and 2029 isarrow_forwardDuring the transition from the short run to the long run, price level expectations will (remain the same, increases, decreases), and the (aggregate demand, short-run aggregate supply) curve will shift to the (left, right). In the long run, as a result of the investment tax credit, the price level (remain the same, increases, decreases), the quantity of output (rises above, falls below, returns to) potential output, and the unemployment rate (rises above, falls below, returns to) the natural rate of unemployment.arrow_forward
- 4arrow_forward2. The Phillips curve in the short run and long run The following graph plots aggregate demand (AD) and aggregate supply (AS) for the imaginary country of Iguazu in the year 2027. Suppose the natural level of output in this economy is $7 trillion. On the following graph, use the green line (triangle symbol) to plot the long-run aggregate supply (LRAS) curve for this economy. PRICE LEVEL 108 107 LRAS AS 108 105 104 103 102 101 A AD AD 100 2 4 10 12 14 16 OUTPUT (Trillions of dollars) Outcome C Economists forecast that if the government takes no action and the economy continues to grow at the current rate, aggregate demand in 2028 will be given by the curve labeled ADA, resulting in the outcome given by point A. If, however, the government pursues an expansionary policy, aggregate demand in 2028 will be given by the curve labeled ADB, resulting in the outcome given by point B. The following table presents projections for the unemployment rates that would occur at point A and point B.…arrow_forwardQuestion 1 Suppose that environmental regulations require firms to reduce emissions and pollution during production. Firms then charge higher prices to cover the costs of compliance with the regulations. Suppose that new technology is used in the production of output now to reduce pollution and emissions at a much lower cost. This new technology decreases the cost of compliance with environmental regulations. a. Is the use of new technology a demand or a supply shock? Why? b. Use the aggregate demand-aggregate supply model to illustrate graphically and explain the impact in the short run and the long run of the shock. Be sure to label: į, the axes; ii. the curves; iii. the initial equilibrium values; iv. the direction the curves shift; v. the short-run equilibrium values; and vi. the long-run equilibrium values. Explain in words what happens to prices and output in the short run and the long run.arrow_forward
- Consider the following dialogue about the crash of the housing market and the Great Recession of 2007–2009 between two students in a economics class. Fill in the blank ALEX: Hi, Becky. I’m intrigued to see how macroeconomics allows us to explain recent economic events such as the Great Recession that affected so many people. But there’s one thing I don’t understand. Was the collapse of the housing bubble the only cause of the recession, or were there other factors as well? BECKY: Hi, Alex. I agree that macroeconomic theory offers an entirely new perspective on how the economy works. To answer your question, the crash of the housing market was a major factor but not the only cause of the Great Recession. The professor mentioned that the __________ (options: financial, fiscal, government) system deteriorated as well, an event that deepened the economic downturn even further. ALEX: I see. So the bursting of the housing bubble caused the initial decline in aggregate demand. Then the…arrow_forwardConsider an economic shock that results in a decrease in aggregate demand for the economy, creating an output gap where GDP is lower than potential.In the short run, what is the expected changes to firm production levels, the price level in the economy, and the unemployment rate?2. In the medium run, what happens to capacity utilization? How do changes to capacity and unemployment cause pressure for lower inflation? What is the expected response from the Federal Reserve? 3. In the long run, what is the expected outcome for GDP, unemployment, and inflation if monetary policy is successful?arrow_forward8. Problems and Applications Q8 As described in the chapter, the Federal Reserve in 2008 faced a decrease in aggregate demand caused by the housing and financial crises and a decrease in short-run aggregate supply caused by rising commodity prices. Starting from a long-run equilibrium, illustrate the effects of these two changes on aggregate supply and aggregate demand on the following graph. Then on the subsequent graph, indicate what happens in a Phillips-curve diagram. Price Level LRAS Aggregate Supply * Aggregate Demand Quantity of Output Aggregate Demand Aggregate Supply LRAS Long-Run Equilibrium (?)arrow_forward
- Please mark true or false for the following statements. 1. When there are adaptive expectations, it implies that there is persistence (inertia) in inflation:arrow_forwardSuppose the economy is in a situation of moderate unemployment, and then an exogenous increase of aggregate demand occurs. (Assume the aggregate demand schedule follows the pattern set out by the mainstream story.) Use short run aggregate supply and aggregate demand analysis to discuss in detail the effects of this demand change on the price level and real GDP in the short run. Explain how the situation could change in the long run after the happenings in the first part.arrow_forwardWhat happened to the demand for rental cars during the first half of 2021? I.e., was there a positive or negative demand shock? What caused the shock?arrow_forward

 Principles of Economics (12th Edition)EconomicsISBN:9780134078779Author:Karl E. Case, Ray C. Fair, Sharon E. OsterPublisher:PEARSON
 Engineering Economy (17th Edition)EconomicsISBN:9780134870069Author:William G. Sullivan, Elin M. Wicks, C. Patrick KoellingPublisher:PEARSON
 Principles of Economics (MindTap Course List)EconomicsISBN:9781305585126Author:N. Gregory MankiwPublisher:Cengage Learning
 Managerial Economics: A Problem Solving ApproachEconomicsISBN:9781337106665Author:Luke M. Froeb, Brian T. McCann, Michael R. Ward, Mike ShorPublisher:Cengage Learning
 Managerial Economics & Business Strategy (Mcgraw-...EconomicsISBN:9781259290619Author:Michael Baye, Jeff PrincePublisher:McGraw-Hill Education


