ENGR.ECONOMIC ANALYSIS
14th Edition
ISBN: 9780190931919
Author: NEWNAN
Publisher: Oxford University Press
expand_more
expand_more
format_list_bulleted
Question
1 . Aggregate demand,
OPTIONS:
Blank 1: Outcome A/Outcome B
Blank 2: 2.94%, 0.98%, 5%, 3%
Blank 3: movement along/shift
Blank 4/5: a decrease/an increase

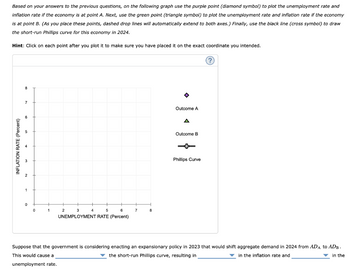
Transcribed Image Text:Based on your answers to the previous questions, on the following graph use the purple point (diamond symbol) to plot the unemployment rate and
inflation rate if the economy is at point A. Next, use the green point (triangle symbol) to plot the unemployment rate and inflation rate if the economy
is at point B. (As you place these points, dashed drop lines will automatically extend to both axes.) Finally, use the black line (cross symbol) to draw
the short-run Phillips curve for this economy in 2024.
Hint: Click on each point after you plot it to make sure you have placed it on the exact coordinate you intended.
INFLATION RATE (Percent)
8
7
0
0
1
2
3
5
6
UNEMPLOYMENT RATE (Percent)
4
7
8
Outcome A
A
Outcome B
Phillips Curve
Suppose that the government is considering enacting an expansionary policy in 2023 that would shift aggregate demand in 2024 from ADA to ADB.
the short-run Phillips curve, resulting in
in the inflation rate and
This would cause a
in the
unemployment rate.

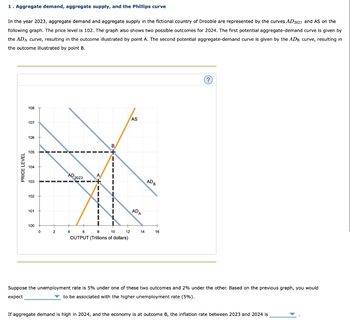
Transcribed Image Text:1. Aggregate demand, aggregate supply, and the Phillips curve
In the year 2023, aggregate demand and aggregate supply in the fictional country of Drooble are represented by the curves AD2023 and AS on the
following graph. The price level is 102. The graph also shows two possible outcomes for 2024. The first potential aggregate-demand curve is given by
the ADA curve, resulting in the outcome illustrated by point A. The second potential aggregate-demand curve is given by the ADB curve, resulting in
the outcome illustrated by point B.
PRICE LEVEL
108
107
106
105
104
103
102
101
100
0
2
AD 2023 A
4
===
I
I
B
T
1
6
8
12
10
OUTPUT (Trillions of dollars)
AS
ADA
14
ADB
16
?
Suppose the unemployment rate is 5% under one of these two outcomes and 2% under the other. Based on the previous graph, you would
expect
to be associated with the higher unemployment rate (5%).
If aggregate demand is high in 2024, and the economy is at outcome B, the inflation rate between 2023 and 2024 is
Expert Solution
This question has been solved!
Explore an expertly crafted, step-by-step solution for a thorough understanding of key concepts.
This is a popular solution
Trending nowThis is a popular solution!
Step by stepSolved in 5 steps with 1 images

Knowledge Booster
Learn more about
Need a deep-dive on the concept behind this application? Look no further. Learn more about this topic, economics and related others by exploring similar questions and additional content below.Similar questions
- 15 Suppose that an economy has the Phillips curve: n = n(-1)-0.5 (u - 0.05) a. What is the natural rate of unemployment? How much cyclical unemployment is necessary to reduce inflation by 3 percentage points? Using Okun's law, compute the sacrifice ratio. b. Inflation is running at 6 percent. The central bank wants to reduce it to 2 percent. Give two scenarios that will achieve that goal.arrow_forwardNote:Hand written solution is not accepted.arrow_forwardCh 6 Economicsarrow_forward
- 3. Explain how a rise in Government expending affects:3.1. The Phillips curve in the short run? How do you think are employers and employees going to react to this policy under adaptive expectations? 3.2. If the demand policy continues to apply how this is going to affect the Philips curve in the long run? 3.3. What about if the agents have rational expectations, is this policy effective?arrow_forwardConsider the Friedman-Phelps model of the Phillips Curve as discussed in lecture. Assume the economy is currently at Y-full employment. When the Fed sells government securities to the public, and there are no other exogenous shocks to the economy, which one of the following is predicted to happen? The actual inflation rate increases, and the unemployment rate increases permanently. O The actual inflation rate increases, and the unemployment rate increases first and then gradually goes back to the natural rate of unemployment. O The actual inflation rate decreases, and the unemployment rate increases first and then gradually goes back to the natural rate of unemployment. The actual inflation rate decreases, and the unemployment rate increases permanently. The actual inflation rate decreases, and the unemployment rate decreases first and then gradually goes back to the natural rate of unemployment.arrow_forward2. Analyze the effects of the following developments on both the short-run and the long-run Phillips curves. Use the graphs and explain in detail: a) a rise in the natural rate of unemployment b) a substantial increase in the price of energyarrow_forward
- Step 1 Plot the graphs. The corresponding table includes a breakdown including Inflation Rate, Unemployment Rate, Price Level, and Real GDP. Using the data below, plot the graphs: Plot the short-run Phillips curve and the aggregate supply curve on separate graphs. Plot the long-run Phillips curve on a separate graph, when the natural unemployment rate is 6%. Inflation Rate Unemployment Rate Price Level Real GD 2% 7% 104 9.8 3% 6% 103 10.0 4% 5% 102 10.2arrow_forwardPlease answer question. Thanks.arrow_forward9. The Phillips curve in the late 20th century The following table presents historical unemployment and inflation data in the United States for the years 1977 through 1981. Year Unemployment Rate Inflation Rate (Percent) (Percent) 1977 7.1 6.5 1978 6.1 7.6 1979 5.8 11.3 1980 7.1 13.5 1981 7.6 10.3 Plot the data for these five years on the following graph. Note: You will not be graded on how you plot the points, but plotting the points accurately on the graph will help you examine the relationship between unemployment and inflation during this period and solve the problems that follow.arrow_forward
- Can you please help me with A) B) and C) please and thanks in advanced.arrow_forwardD Question 1 The short-run Phillips curve is a curve that shows the relationship, other things being constant, between and O the inflation rate; the unemployment rate O the inflation rate; the nominal interest rate O the unemployment rate; real GDP 0.1 pts O potential GDP; the natural unemployment rate O the inflation rate; the expected inflation rate .arrow_forwardI'd like help on first 3 subsectionsarrow_forward
arrow_back_ios
SEE MORE QUESTIONS
arrow_forward_ios
Recommended textbooks for you

 Principles of Economics (12th Edition)EconomicsISBN:9780134078779Author:Karl E. Case, Ray C. Fair, Sharon E. OsterPublisher:PEARSON
 Engineering Economy (17th Edition)EconomicsISBN:9780134870069Author:William G. Sullivan, Elin M. Wicks, C. Patrick KoellingPublisher:PEARSON
 Principles of Economics (MindTap Course List)EconomicsISBN:9781305585126Author:N. Gregory MankiwPublisher:Cengage Learning
 Managerial Economics: A Problem Solving ApproachEconomicsISBN:9781337106665Author:Luke M. Froeb, Brian T. McCann, Michael R. Ward, Mike ShorPublisher:Cengage Learning
 Managerial Economics & Business Strategy (Mcgraw-...EconomicsISBN:9781259290619Author:Michael Baye, Jeff PrincePublisher:McGraw-Hill Education


Principles of Economics (12th Edition)
Economics
ISBN:9780134078779
Author:Karl E. Case, Ray C. Fair, Sharon E. Oster
Publisher:PEARSON

Engineering Economy (17th Edition)
Economics
ISBN:9780134870069
Author:William G. Sullivan, Elin M. Wicks, C. Patrick Koelling
Publisher:PEARSON

Principles of Economics (MindTap Course List)
Economics
ISBN:9781305585126
Author:N. Gregory Mankiw
Publisher:Cengage Learning

Managerial Economics: A Problem Solving Approach
Economics
ISBN:9781337106665
Author:Luke M. Froeb, Brian T. McCann, Michael R. Ward, Mike Shor
Publisher:Cengage Learning

Managerial Economics & Business Strategy (Mcgraw-...
Economics
ISBN:9781259290619
Author:Michael Baye, Jeff Prince
Publisher:McGraw-Hill Education