
Essentials Of Investments
11th Edition
ISBN: 9781260013924
Author: Bodie, Zvi, Kane, Alex, MARCUS, Alan J.
Publisher: Mcgraw-hill Education,
expand_more
expand_more
format_list_bulleted
Related questions
Question
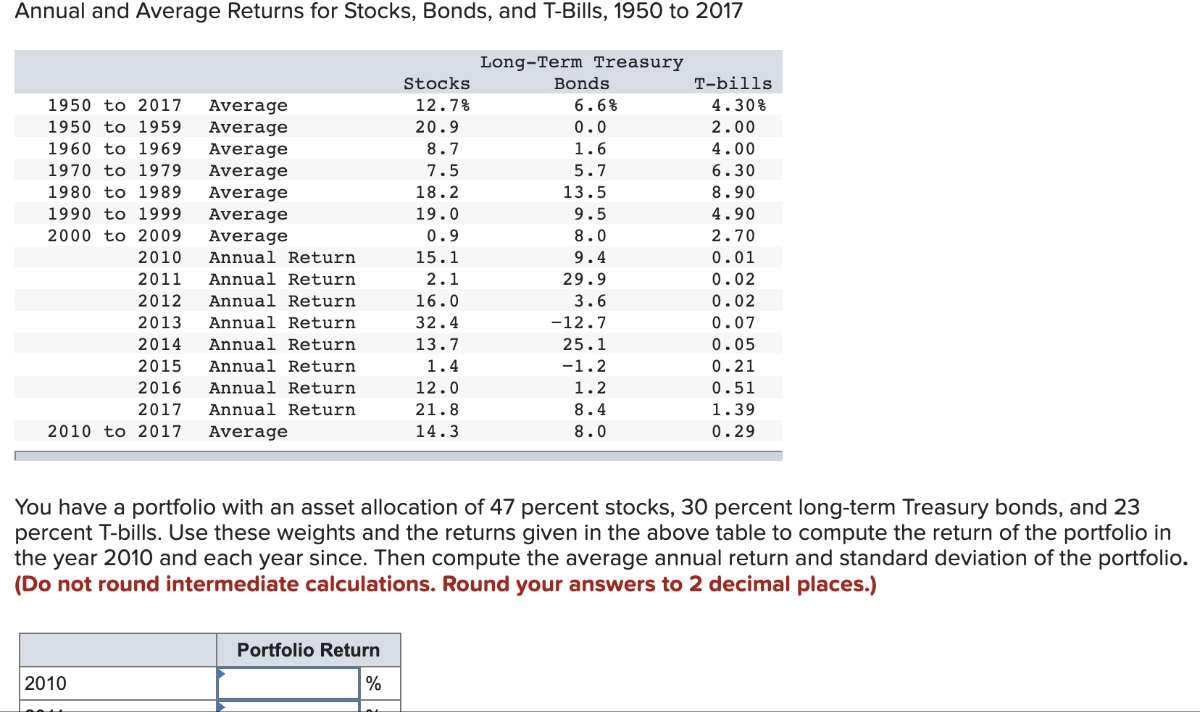

Transcribed Image Text:Annual and Average Returns for Stocks, Bonds, and T-Bills, 1950 to 2017
1950 to 2017 Average
1950 to 1959 Average
1960 to 1969
Average
Average
1970 to 1979
Average
1980 to 1989
1990 to 1999
Average
2000 to 2009
Average
Annual Return
2010
2011 Annual Return
2012 Annual Return
2013 Annual Return
2014 Annual Return
2015 Annual Return
2016 Annual Return
2017
Annual Return
2010 to 2017 Average
2010
Portfolio Return
Stocks
12.7%
20.9
8.7
7.5
%
18.2
19.0
0.9
15.1
2.1
16.0
32.4
13.7
1.4
12.0
21.8
14.3
Long-Term Treasury
Bonds
6.6%
0.0
1.6
5.7
13.5
9.5
8.0
9.4
29.9
3.6
You have a portfolio with an asset allocation of 47 percent stocks, 30 percent long-term Treasury bonds, and 23
percent T-bills. Use these weights and the returns given in the above table to compute the return of the portfolio in
the year 2010 and each year since. Then compute the average annual return and standard deviation of the portfolio.
(Do not round intermediate calculations. Round your answers to 2 decimal places.)
-12.7
25.1
-1.2
1.2
8.4
8.0
T-bills
4.30%
2.00
4.00
6.30
8.90
4.90
2.70
0.01
0.02
0.02
0.07
0.05
0.21
0.51
1.39
0.29
Expert Solution
This question has been solved!
Explore an expertly crafted, step-by-step solution for a thorough understanding of key concepts.

This is a popular solution

Trending nowThis is a popular solution!

Step by stepSolved in 3 steps with 2 images

Knowledge Booster

Similar questions
- Nonearrow_forwardStock A and stock C have the following historical returns: Year Stock A Return Beta Stock C Return Beta 2017 (18%) 0.80 (14.50) 0.90 2018 33% 1.5 21.80% 2.0 2019 15% 2.0 30.50% 1.0 2020 (5.50%) -0.90 (7.60%) -0.50 2021 27% 1.0 26.30% 1.5 a. Calculate the average rate of return for each stock during the period 2017-2021 b. Assume you want to create a portfolio consisting of 60 percent of stock A and 40 percent of stock C, b.1. What would be your realized rate of return on the portfolio have been each year? b.2. What would be your average rate of return on the portfolio have been during this period? c. Calculate the standard deviation of the portfolio return d. Calculate the coefficient of variation for each stock and for the portfolio. e. Assuming you are a risk-averse investor, would you prefer to hold Stock A, Stock B, or the portfolio? Why?arrow_forwardRaghubhaiarrow_forward
- Year AT&T Stock Returns Market Index Returns 1 8 6 2 7 3 3 10 12 4 14 13 5 8 9 Compute the beta for AT&T using the historic returns presented above. Enter answer using 4 decimal places. Example: 0.1234arrow_forwardPlease helparrow_forwardYear ASX 300 Index ASX 300 Dividend Yield (%) Return_risky portfolio 2010 4760.79 3.76 - 2011 4052.27 4.93 -0.147788 2012 4626.27 4.33 0.142718 2013 5304.8 3.99 0.147531 2014 5348.93 4.24 0.009118 2015 5249.09 4.72 -0.017783 2016 5617.73 4.09 0.071008 2017 6023.3 4.04 0.072914 2018 5596.96 4.48 -0.070038 2019 6647.74 3.95 0.188447 2020 6574.33 2.82 -0.010619 Average Std.dev 3.86% 10.56% Year Risk free rate (%) Return_risk-free asset 2011 4.51 - 2012 3.11 -0.309484 2013 2.61 -0.163052 2014 2.75 0.055662 2015 2.34 -0.150000 2016 1.78 -0.238503 2017 1.77 -0.005618 2018 2.02 0.141243 2019 0.90 -0.554455 2020 0.02 -0.977778 Average 2.18 -24.47% Calculate: Assuming E(Rc) = 7%, use E(Rc) = Rf + y* (E(Rp) - Rf) 1. % of Risky Assets: 2. % of Risk Free Assets: 3. Standard Deviation of the portfolioarrow_forward
- Year 2009 2010 2011 2012 2013 2014 2015 2016 Average % (-AVERAGE) SD (%) (-STDEVP) SD (%) (-STDEV.S) PSB 2017 2018 Covariance average product of deviations COVAR Correlation = Cov/(SDs * SDb) CORREL (=CORREL) Rates of Return Stock Fund (%) Bond Fund (%) 30.17 5.08 32.97 7.52 21.04 -8.82 -8.10 5.27 -12.89 12.20 -28.53 -7.79 22.49 6.38 12.58 12.40 14.81 17.29 15.50 0.51 Cov(rs,B) OS XOB Slope (Beta) Deviation from Average Returns Stock Fund Bond Fund Product of Deviations Squared Deviation Stock Fund Bond Fund Variance (n) Formula Calculations. Variance (n-1) Formula Calculationsarrow_forwardThe following information is related to X corporation: X's Beta was 1.3, market index 1 January 2020 was 100, market index 31 December 2020 was 110 and interest on treasury bills was 0.03 (risk free). Stock returns using the capital assets pricing model Question 20Answer a. 0.132 b. 0.143 c. 0.112 d. 0.121arrow_forward19. You have developed data which give (1) the percentage annual returns of the market for the past five years and (2) similar percentage annual returns information on Stocks A and B. Which of the possible answers best describes the historical beta for A and B? Years Market % returns Stock A % returns Stock B % returns 2023 3% 16% 5% 2022 5% 20% 5% 2021 1% 10% 5% 2020 -10% -25% 5% 2019 6% 24% 5% A) bA > 0; bB = 1. B) bA > +1; bB = 0. C) bA = 0; bB < ─1. D) bA < +1; bB = 0. E) bA > ─1; bB > 1. F) None of the above (state your answer)arrow_forward
- The following return series comes from Global Financial Data. Year Large Stocks LT Gov Bonds US T-bills CPI (Rf asset) (inflation) 2017 21.83% 6.24% 0.80% 2.07% 2018 -5.28% -1.25% 1.81% 2.10% 2019 25.45% 3.35% 2.15% 1.10% 2020 18.16% 10.25% 4.50% 1.88% 2021 28.70% -1.54% 0.40% 7.00% 2022 -19.78% -8.55% 2.20% 6.50% Calculate the average nominal return earned on large-company stocks. (Enter percentages as decimals and round to 4 decimals)arrow_forwardUse the following tables to assess the worthiness of Verticon stock as an investment. Verticon Stock Data (Current and Historical) 3:45PM EDT Aug 16, 2011 Price 18.85 USD Change +0.64 (+3.51%) Mkt cap 147.1B Div/yield 0.20/4.24 Shares 8,012 Beta 0.70 Book/share 11.335 EPS 1.11 12/2010 12/2009 12/2008 (Millions of Dollars) Total Assets 195,014 195,949 111,148 Total Liabilities 107,201 122,935 53,592 Preferred Shareholders’ Equity 52 61 73 Common Shareholders’ Equity 87,761 72,953 57,483 Shares Outstanding 8,012 8,070 6746 Book/Share ? 9.040 8.521 Q1 (Mar ’11) 2010 Net profit margin 15.24% 12.24% Return on equity 11.60% 9.30% Which one in bold? One of the most important features of a stock is its book value. The book value per share of Verticon’s stock for the year 2010 was equal to (10.954, 13.693, 11.502). Looking at the (Market cap, EPS, change in price, beta value, ROE) ,…arrow_forwardbook nt Consider the following table for a period of six years: Returns U.S. Treasury Year Large-Company Stocks Bills 1 -14.99% 7.35% 2 -26.56 8.02 3 37.29 5.93 4 23.99 5.37 5 -7.28 5.48 6 6.63 7.73 a-1. Calculate the arithmetic average returns for large-company stocks and T-bills over this time period. Note: Do not round intermediate calculations and enter your answers as a percent rounded to 2 decimal places, e.g., 32.16. a-2. Calculate the standard deviation of the returns for large-company stocks and T-bills over this time period. Note: Do not round intermediate calculations and enter your answers as a percent rounded to 2 decimal places, e.g., 32.16. int Large-company stocks T-bills a-1. Arithmetic average return a-2. Standard deviation % % % % ences Calculate the observed risk premium in each year for the large-company stocks versus the T-bills. b-1. What was the arithmetic average risk premium over this period? Note: A negative answer should be indicated by a minus sign. Do not…arrow_forward
arrow_back_ios
SEE MORE QUESTIONS
arrow_forward_ios
Recommended textbooks for you
- Essentials Of InvestmentsFinanceISBN:9781260013924Author:Bodie, Zvi, Kane, Alex, MARCUS, Alan J.Publisher:Mcgraw-hill Education,


 Foundations Of FinanceFinanceISBN:9780134897264Author:KEOWN, Arthur J., Martin, John D., PETTY, J. WilliamPublisher:Pearson,
 Fundamentals of Financial Management (MindTap Cou...FinanceISBN:9781337395250Author:Eugene F. Brigham, Joel F. HoustonPublisher:Cengage Learning
 Corporate Finance (The Mcgraw-hill/Irwin Series i...FinanceISBN:9780077861759Author:Stephen A. Ross Franco Modigliani Professor of Financial Economics Professor, Randolph W Westerfield Robert R. Dockson Deans Chair in Bus. Admin., Jeffrey Jaffe, Bradford D Jordan ProfessorPublisher:McGraw-Hill Education
Essentials Of Investments
Finance
ISBN:9781260013924
Author:Bodie, Zvi, Kane, Alex, MARCUS, Alan J.
Publisher:Mcgraw-hill Education,
Foundations Of Finance
Finance
ISBN:9780134897264
Author:KEOWN, Arthur J., Martin, John D., PETTY, J. William
Publisher:Pearson,
Fundamentals of Financial Management (MindTap Cou...
Finance
ISBN:9781337395250
Author:Eugene F. Brigham, Joel F. Houston
Publisher:Cengage Learning
Corporate Finance (The Mcgraw-hill/Irwin Series i...
Finance
ISBN:9780077861759
Author:Stephen A. Ross Franco Modigliani Professor of Financial Economics Professor, Randolph W Westerfield Robert R. Dockson Deans Chair in Bus. Admin., Jeffrey Jaffe, Bradford D Jordan Professor
Publisher:McGraw-Hill Education