
MATLAB: An Introduction with Applications
6th Edition
ISBN: 9781119256830
Author: Amos Gilat
Publisher: John Wiley & Sons Inc
expand_more
expand_more
format_list_bulleted
Related questions
Question
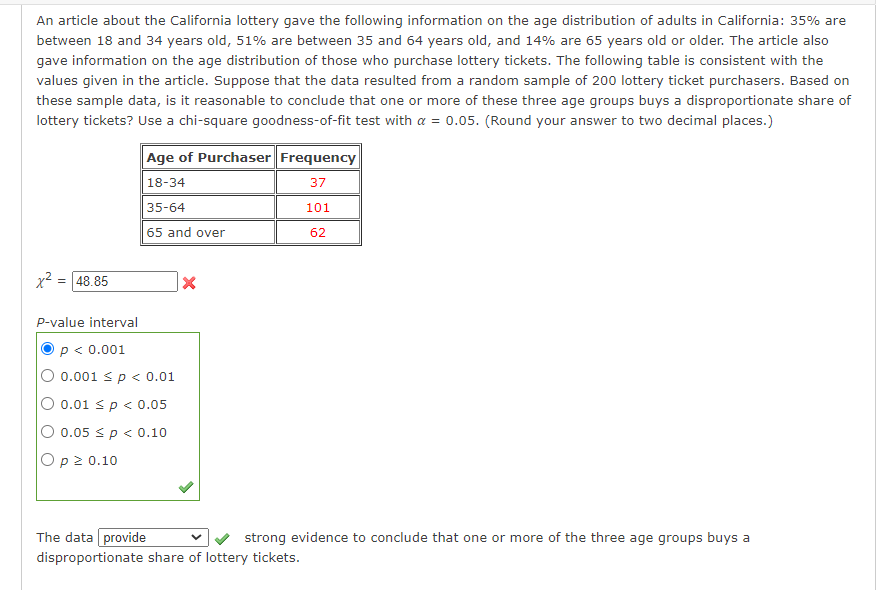

Transcribed Image Text:An article about the California lottery gave the following information on the age distribution of adults in California: 35% are
between 18 and 34 years old, 51% are between 35 and 64 years old, and 14% are 65 years old or older. The article also
gave information on the age distribution of those who purchase lottery tickets. The following table is consistent with the
values given in the article. Suppose that the data resulted from a random sample of 200 lottery ticket purchasers. Based on
these sample data, is it reasonable to conclude that one or more of these three age groups buys a disproportionate share of
lottery tickets? Use a chi-square goodness-of-fit test with a = 0.05. (Round your answer to two decimal places.)
x² = 48.85
Age of Purchaser Frequency
18-34
37
35-64
101
65 and over
62
P-value interval
P < 0.001
0.001 < p < 0.01
O 0.01 < p < 0.05
O 0.05 < p < 0.10
Op ≥ 0.10
X
The data provide
strong evidence to conclude that one or more of the three age groups buys a
disproportionate share of lottery tickets.
Expert Solution
This question has been solved!
Explore an expertly crafted, step-by-step solution for a thorough understanding of key concepts.

This is a popular solution

Trending nowThis is a popular solution!

Step by stepSolved in 3 steps with 1 images

Knowledge Booster

Similar questions
- 1. Baseball Stats Does a team's batting average depend in any way on the number of runs scored by the team? The data in the table are the 2017 team batting averages and the number of runs for a sample of 10 MLB teams. Team Atlanta Braves Boston Red Sox Cincinnati Reds Detroit Tigers Houston Astros Kansas City Royals Miami Marins Minnesota Twins Pittsburgh Pirates Texas Rangers Team Batting Average 0.263 0.258 0.253 0.258 0.282 0.259 0.267 0.260 0.244 0.244 Only answer the following questions: a. Calculate S² and S Number of Runs 732 785 753 735 896 702 778 815 668 799arrow_forwardHelp!!arrow_forwardWhen I was an undergraduate, I helped my father conduct some Child Psychology research about parental influence on gender bias. In this study we interviewed 158 kindergarteners. Our initial question was "What is your favorite color?" where we studied the distribution of "Pink" and "Blue" responses. To our surprise, 38 of the students interviewed responded "Turquoise". Use this information to select the response which correctly answers the question. According to this description, which term best describes our study? O Cross-Sectional O Retrospective O Prospectivearrow_forward
- The accompanying table contains historical data on staff salaries (in dollars per pupil) for 30 schools sampled in part of a country in the early 1970s. I need help with this part attached. 3.86 2.80 2.71 2.95 3.08 1.802.60 3.32 2.52 2.12 2.58 2.682.76 2.85 3.67 3.84 3.43 2.122.94 2.83 3.04 2.43 2.18 3.693.21 3.67 2.39 2.61 3.42 3.45 The sample mean is 2.9183 The sample standard deviation is 0.5495arrow_forwardA social scientist wanted to study the education levels of adults who live in the tristate area of southwestern Pennsylvania, the West Virginia panhandle, and southeastern Ohio. A random sample of 25 middle-aged adults from each region was selected and asked about their highest level of education. The responses are displayed in the table. The scientist would like to know if these data provide convincing evidence that the distribution of education differs for these regions in the population of all tristate residents. Are the conditions for inference met? No, the random condition is not met. No, the 10% condition is not met. No, the Large Counts condition is not met. Yes, all three conditions for inference are met.arrow_forwardDoes it seem to you that people tend to be absent more on some days of the week than on others? Recently, a major biotechnology firm collected data with the hope of determining whether or not its employees were more likely to be absent (due to personal reasons or illness) on some weekdays than on others. The firm examined a random sample of 150 employee absences. The distribution of these 150 absences is shown in the table below. The observed frequency for each category (each weekday) is shown in the first row of numbers. The second row of numbers contains the frequencies expected for a sample of 150 employees if employee absences at the firm are equally likely on each of the five weekdays. The bottom row of numbers contains the following value for each of the categories.arrow_forward
- Matt Gaetz, a health educator, wants to evaluate the effect of a dental film on the frequency with which children brush their teeth. A random selection of 8 children are used for the experiment. First, a baseline of the number of times the children brush their teeth over a month's period is established. Next, the children are shown the dental film and again the number of teeth brushings are recorded for a month. The following data are recorded. Subject 1 2 3 4 5 6 7 8 After Film 28 29 25 30 25 27 28 24 Baseline 25 28 22 30 26 24 25 22 a. What is the null hypothesis? b. What is the alternative hypothesis c. What is your conclusion, using an alpha of 0.05 (2 tailed)?arrow_forwardA researcher randomly purchases several different kits of a popular building toy. The following table shows the number of pieces in each kit in the sample. Find the median of the data. Building Toy Pieces 160 45 265 350 150 45 104 296 265 109 170 208arrow_forwarda. P(Democrat|same) = b. P(Democrat and same) =arrow_forward
- The 2008 general social survey asked a nationally representative sample of 1324 adult americans to report how many hours of television they watch in a typical day. The resulting data are reported in the following table counts. Median number of hours of tv watching per dayarrow_forwardAre birthdays "evenly distributed" throughout the year, or are they more common during some parts of the year than others? Owners of a children's toy store chain asked this question. Some data collected by the chain are summarized in the table below. The data were obtained from a random sample of 180 people. The birthdate of each person was recorded, and each of these dates was placed into one of four categories: winter (December 21-March 20), spring (March 21-June 20), summer (June 21-September 20), and fall (September 21-December 20). The numbers in the first row of the table are the frequencies observed in the sample for these season categories. The numbers in the second row are the expected frequencies under the assumption that birthdays are equally likely during each season of the year. The bottom row of numbers gives the following value for each of the season categories. (Each expert I have asked has gotten the critical value wrong so I added a picture of the correct formula to…arrow_forwardA government agency computed the proportion of U.S. residents who lived in each of four geographic regions in a particular year. Then a simple random sample was drawn of 1000 people living in the United States in the current year. The following table presents the results. Region Past YearProportion ObservedCounts Northeast 0.171 150 Midwest 0.245 235 South 0.357 398 West 0.227 217 Send data to Excel Can you conclude that the proportions of people living in the various regions changed between the current year and the past year? Use the 0.05 level of significance and the P-value method with the TI-84 Plus calculator. What the P value?arrow_forward
arrow_back_ios
SEE MORE QUESTIONS
arrow_forward_ios
Recommended textbooks for you
- MATLAB: An Introduction with ApplicationsStatisticsISBN:9781119256830Author:Amos GilatPublisher:John Wiley & Sons Inc
 Probability and Statistics for Engineering and th...StatisticsISBN:9781305251809Author:Jay L. DevorePublisher:Cengage Learning
 Statistics for The Behavioral Sciences (MindTap C...StatisticsISBN:9781305504912Author:Frederick J Gravetter, Larry B. WallnauPublisher:Cengage Learning
  Elementary Statistics: Picturing the World (7th E...StatisticsISBN:9780134683416Author:Ron Larson, Betsy FarberPublisher:PEARSON
 The Basic Practice of StatisticsStatisticsISBN:9781319042578Author:David S. Moore, William I. Notz, Michael A. FlignerPublisher:W. H. Freeman
 Introduction to the Practice of StatisticsStatisticsISBN:9781319013387Author:David S. Moore, George P. McCabe, Bruce A. CraigPublisher:W. H. Freeman
MATLAB: An Introduction with Applications
Statistics
ISBN:9781119256830
Author:Amos Gilat
Publisher:John Wiley & Sons Inc
Probability and Statistics for Engineering and th...
Statistics
ISBN:9781305251809
Author:Jay L. Devore
Publisher:Cengage Learning
Statistics for The Behavioral Sciences (MindTap C...
Statistics
ISBN:9781305504912
Author:Frederick J Gravetter, Larry B. Wallnau
Publisher:Cengage Learning
Elementary Statistics: Picturing the World (7th E...
Statistics
ISBN:9780134683416
Author:Ron Larson, Betsy Farber
Publisher:PEARSON
The Basic Practice of Statistics
Statistics
ISBN:9781319042578
Author:David S. Moore, William I. Notz, Michael A. Fligner
Publisher:W. H. Freeman
Introduction to the Practice of Statistics
Statistics
ISBN:9781319013387
Author:David S. Moore, George P. McCabe, Bruce A. Craig
Publisher:W. H. Freeman