
MATLAB: An Introduction with Applications
6th Edition
ISBN: 9781119256830
Author: Amos Gilat
Publisher: John Wiley & Sons Inc
expand_more
expand_more
format_list_bulleted
Related questions
Question
(a) Compute the value of the test statistic. Round your answer to three decimal places.
(b) Draw a conclusion and interpret the decision.
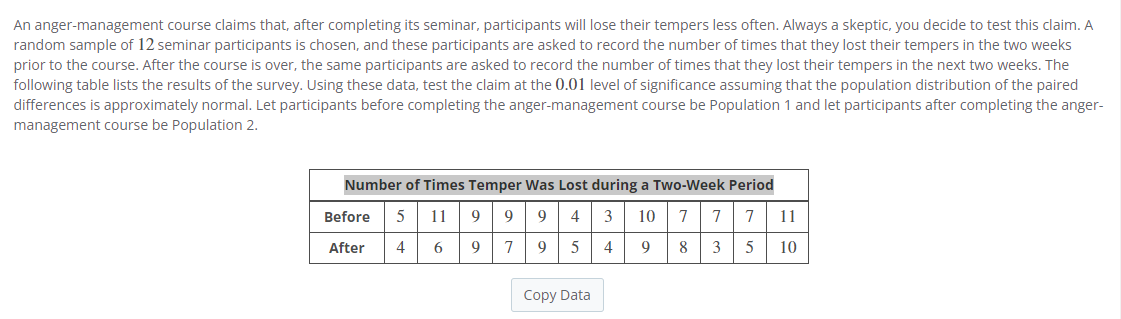

Transcribed Image Text:An anger-management course claims that, after completing its seminar, participants will lose their tempers less often. Always a skeptic, you decide to test this claim. A
random sample of 12 seminar participants is chosen, and these participants are asked to record the number of times that they lost their tempers in the two weeks
prior to the course. After the course is over, the same participants are asked to record the number of times that they lost their tempers in the next two weeks. The
following table lists the results of the survey. Using these data, test the claim at the 0.01 level of significance assuming that the population distribution of the paired
differences is approximately normal. Let participants before completing the anger-management course be Population 1 and let participants after completing the anger-
management course be Population 2.
Number of Times Temper Was Lost during a Two-Week Period
11 9
9 4 3 10
7 7
7
11
6
9
9 5
4
9
8
3
5 10
Before
After
5
4
9
7
Copy Data
Expert Solution
This question has been solved!
Explore an expertly crafted, step-by-step solution for a thorough understanding of key concepts.

This is a popular solution

Trending nowThis is a popular solution!

Step by stepSolved in 3 steps with 1 images

Knowledge Booster

Similar questions
- Quit smoking: A recent study reported that in a sample of 234 European-American HIV-positive smokers, 105 of them had used a nicotine patch to try to quit smoking, and in a sample of 81 Hispanic-American HIV-positive smokers, 25 had used a nicotine patch. Can you conclude that the proportion of patch users is greater among European-Americans? Let p₁ denote the proportion of European-Americans who used the patch. Use the a=0.01 level of significance. Part 1 of 4 (a) State the appropriate null and alternate hypotheses. Ho: P₁ (Choose one) ▼ P₂ H₁: P₁ (Choose one) P2 This is a (Choose one) test. Part 2 of 4 (b) Find the P-value. Round the answer to four decimal places. P-value= X S Śarrow_forwardUse the random numbers. Thank you.arrow_forwardIn a random sample of seven people, the mean driving distance to work was 22.5 miles and the standard deviation was 5.9 miles. Assume the population is normally distributed and use the t-distribution to find the margin of error and construct a 95% confidence interval for the population mean u. Interpret the results. Identify the margin of error. (Round to one decimal place as needed.) Construct a 95% confidence interval for the population mean. (Round to one decimal place as needed.) Interpret the results. Select the correct choice below and fill in the answer box to complete your choice. (Type an integer or a decimal. Do not round.) O A. With % confidence, it can be said that most driving distances to work (in miles) in the population are between the interval's endpoints. O B. It can be said that % of the population has a driving distance to work (in miles) that is between the interval's endpoints. OC. With % confidence, it can be said that the population mean driving distance to work…arrow_forward
- Carmen and Rosanna are two employees in an electronics store. The store manager has put an emphasis on increasing the number of applications for the store credit card. The manager randomly selected 24 weeks for each employee and recorded the number of completed applications for each week, which is provided in the samples below. Each employee completed 21 applications in one of the weeks selected. Use Excel to calculate each employee's z-score for completing 21 applications. Round your answers to two decimal places. Carmen Rosanna11 56 1115 613 185 1114 1416 521 208 1110 97 1416 1513 1310 619 2118 95 1817 310 126 1712 1214 419 1017 8arrow_forwardClaim: Fewer than 94 % of adults have a cell phone. In a reputable poll of 1119 adults, 87 % said that they have a cell phone. Find the value of the test statistic.arrow_forwardWinston has just gone grocery shopping. The mean cost for each item in his bag was $3.48. He bought a total of 9 items, and the prices of 8 of those items are listed below: $2.75,$4.06,$3.16,$3.92,$4.29,$2.77,$3.01,$4.57 Determine the price of the 9th item in his bag.arrow_forward
- Test whether males are less likely than females to support a ballot initiative, if 23% of a random sample of 50 males plan to vote yes on the initiative and 32% of a random sample of 50 females plan to vote yes.arrow_forwardind the number of successes x suggested by the given statement: From a CNN/USA Today/Gallup poll: Among 1299 survey subjects, 13.7 % say that the opinion of a celebrity would influence their own opinion. x = nothing (round off to a whole number)arrow_forward
arrow_back_ios
arrow_forward_ios
Recommended textbooks for you
- MATLAB: An Introduction with ApplicationsStatisticsISBN:9781119256830Author:Amos GilatPublisher:John Wiley & Sons Inc
 Probability and Statistics for Engineering and th...StatisticsISBN:9781305251809Author:Jay L. DevorePublisher:Cengage Learning
 Statistics for The Behavioral Sciences (MindTap C...StatisticsISBN:9781305504912Author:Frederick J Gravetter, Larry B. WallnauPublisher:Cengage Learning
  Elementary Statistics: Picturing the World (7th E...StatisticsISBN:9780134683416Author:Ron Larson, Betsy FarberPublisher:PEARSON
 The Basic Practice of StatisticsStatisticsISBN:9781319042578Author:David S. Moore, William I. Notz, Michael A. FlignerPublisher:W. H. Freeman
 Introduction to the Practice of StatisticsStatisticsISBN:9781319013387Author:David S. Moore, George P. McCabe, Bruce A. CraigPublisher:W. H. Freeman
MATLAB: An Introduction with Applications
Statistics
ISBN:9781119256830
Author:Amos Gilat
Publisher:John Wiley & Sons Inc
Probability and Statistics for Engineering and th...
Statistics
ISBN:9781305251809
Author:Jay L. Devore
Publisher:Cengage Learning
Statistics for The Behavioral Sciences (MindTap C...
Statistics
ISBN:9781305504912
Author:Frederick J Gravetter, Larry B. Wallnau
Publisher:Cengage Learning
Elementary Statistics: Picturing the World (7th E...
Statistics
ISBN:9780134683416
Author:Ron Larson, Betsy Farber
Publisher:PEARSON
The Basic Practice of Statistics
Statistics
ISBN:9781319042578
Author:David S. Moore, William I. Notz, Michael A. Fligner
Publisher:W. H. Freeman
Introduction to the Practice of Statistics
Statistics
ISBN:9781319013387
Author:David S. Moore, George P. McCabe, Bruce A. Craig
Publisher:W. H. Freeman