MATLAB: An Introduction with Applications
6th Edition
ISBN: 9781119256830
Author: Amos Gilat
Publisher: John Wiley & Sons Inc
expand_more
expand_more
format_list_bulleted
Question

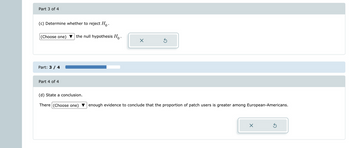
Transcribed Image Text:Part 3 of 4
(c) Determine whether to reject Ho.
(Choose one)
Part: 3 / 4
Part 4 of 4
the null hypothesis Ho.
(d) State a conclusion.
There (Choose one)
X
Ś
enough evidence to conclude that the proportion of patch users is greater among European-Americans.
×
Ś

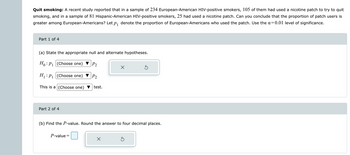
Transcribed Image Text:Quit smoking: A recent study reported that in a sample of 234 European-American HIV-positive smokers, 105 of them had used a nicotine patch to try to quit
smoking, and in a sample of 81 Hispanic-American HIV-positive smokers, 25 had used a nicotine patch. Can you conclude that the proportion of patch users is
greater among European-Americans? Let p₁ denote the proportion of European-Americans who used the patch. Use the a=0.01 level of significance.
Part 1 of 4
(a) State the appropriate null and alternate hypotheses.
Ho: P₁
(Choose one) ▼ P₂
H₁: P₁
(Choose one)
P2
This is a
(Choose one) test.
Part 2 of 4
(b) Find the P-value. Round the answer to four decimal places.
P-value=
X
S
Ś
Expert Solution
This question has been solved!
Explore an expertly crafted, step-by-step solution for a thorough understanding of key concepts.
This is a popular solution
Trending nowThis is a popular solution!
Step by stepSolved in 7 steps with 11 images

Knowledge Booster
Similar questions
- In an SPSS analysis between Race and Prestige, which one would be the IV and which one would be the DV?arrow_forwardA researcher found that the two groups (n=25 in each group) they tested were significantly different from each other with a t-value of 2.91, which has a corresponding p-value of p=.06. For this study, report the statistics in APA format.arrow_forwardA researcher wants to know whether children with ADHD tend to watch more TV than children who are not diagnosed with the disorder. To examine this, a researcher obtains a sample of n = 36 children (ages 8 to 12 years) who have been diagnosed with ADHD. Each child is asked to keep a journal recording how much time each day is spent watching TV. The average for the sample is M = 4.9 hours/day. Assume that the average TV-watching time for the general population of 8-to-12-year-old children is µ = 4.1 hours/day with σ = 1.8. Is ADHD in children associated with an increased amount of TV-watching?arrow_forward
- Refer to the data presented in Exercise 2.86. Note that there were 50% more accidents in the 25 to less than 30 age group than in the 20 to less than 25 age group. Does this suggest that the older group of drivers in this city is more accident- prone than the younger group? What other explanation might account for the difference in accident rates?arrow_forwardBighorn sheep are beautiful wild animals found throughout the western United States. Let x be the age of a bighorn sheep (in years), and let y be the mortality rate (percent that die) for this age group. For example, x = 1, y = 14 means that 14% of the bighorn sheep between 1 and 2 years old died. A random sample of Arizona bighorn sheep gave the following information: x 1 2 3 4 5 y 15.8 17.3 14.4 19.6 20.0 Σx = 15; Σy = 87.1; Σx2 = 55; Σy2 = 1,540.45; Σxy = 272 (a) Find x, y, b, and the equation of the least-squares line. (Round your answers for x and y to two decimal places. Round your least-squares estimates to three decimal places.) x = y = b = ŷ = + x (b) Draw a scatter diagram for the data. Plot the least-squares line on your scatter diagram. (c) Find the sample correlation coefficient r and the coefficient of determination r2. (Round your answers to three decimal places.) r = r2 = What percentage of variation in y is…arrow_forwardBighorn sheep are beautiful wild animals found throughout the western United States. Let x be the age of a bighorn sheep (in years), and let y be the mortality rate (percent that die) for this age group. For example, x = 1, y = 14 means that 14% of the bighorn sheep between 1 and 2 years old died. A random sample of Arizona bighorn sheep gave the following information: x 1 2 3 4 5 y 13.8 19.3 14.4 19.6 20.0 Σx = 15; Σy = 87.1; Σx2 = 55; Σy2 = 1554.45; Σxy = 274b) Find the equation of the least-squares line. (Round your answers to two decimal places.) ŷ = + x (c) Find r. Find the coefficient of determination r2. (Round your answers to three decimal places.) r = r2 = d) Test the claim that the population correlation coefficient is positive at the 1% level of significance. (Round your test statistic to three decimal places.) t =arrow_forward
- In a survey of 1150 adult males, 805 said they use the Internet. In a survey of 1050females, 746 said they use the Internet. Atα= 0.05, can you reject the claim that the proportion of Internet users are the same for both groups?arrow_forwardBighorn sheep are beautiful wild animals found throughout the western United States. Let x be the age of a bighorn sheep (in years), and let y be the mortality rate (percent that die) for this age group. For example, x = 1, y = 14 means that 14% of the bighorn sheep between 1 and 2 years old died. A random sample of Arizona bighorn sheep gave the following information: x 1 2 3 4 5 y 15.8 17.3 14.4 19.6 20.0 Σx = 15; Σy = 87.1; Σx2 = 55; Σy2 = 1,540.45; Σxy = 272 (a) Find x, y, b, and the equation of the least-squares line. (Round your answers for x and y to two decimal places. Round your least-squares estimates to three decimal places.) x = y = b = ŷ = + xarrow_forwardWhat are the missing values for Between and Within treatment, in terms of DF, MS and F?arrow_forward
- Suppose an experiment finds that people taking a new herbal remedy get fewer colds than people taking a placebo. The results are statistically significant at the 0.01 level. Has the experiment proven that the herbal remedy works?arrow_forwardForeign freshmen are required to take an English placement exam. Over the past several years, 20% of the new students have failed the test and have been placed in remedial classes. In a sample of n = 100 students from this year’s class, only 12 failed the test.arrow_forward
arrow_back_ios
arrow_forward_ios
Recommended textbooks for you
 MATLAB: An Introduction with ApplicationsStatisticsISBN:9781119256830Author:Amos GilatPublisher:John Wiley & Sons Inc
 Probability and Statistics for Engineering and th...StatisticsISBN:9781305251809Author:Jay L. DevorePublisher:Cengage Learning
 Statistics for The Behavioral Sciences (MindTap C...StatisticsISBN:9781305504912Author:Frederick J Gravetter, Larry B. WallnauPublisher:Cengage Learning
 Elementary Statistics: Picturing the World (7th E...StatisticsISBN:9780134683416Author:Ron Larson, Betsy FarberPublisher:PEARSON
 The Basic Practice of StatisticsStatisticsISBN:9781319042578Author:David S. Moore, William I. Notz, Michael A. FlignerPublisher:W. H. Freeman
 Introduction to the Practice of StatisticsStatisticsISBN:9781319013387Author:David S. Moore, George P. McCabe, Bruce A. CraigPublisher:W. H. Freeman

MATLAB: An Introduction with Applications
Statistics
ISBN:9781119256830
Author:Amos Gilat
Publisher:John Wiley & Sons Inc

Probability and Statistics for Engineering and th...
Statistics
ISBN:9781305251809
Author:Jay L. Devore
Publisher:Cengage Learning

Statistics for The Behavioral Sciences (MindTap C...
Statistics
ISBN:9781305504912
Author:Frederick J Gravetter, Larry B. Wallnau
Publisher:Cengage Learning

Elementary Statistics: Picturing the World (7th E...
Statistics
ISBN:9780134683416
Author:Ron Larson, Betsy Farber
Publisher:PEARSON

The Basic Practice of Statistics
Statistics
ISBN:9781319042578
Author:David S. Moore, William I. Notz, Michael A. Fligner
Publisher:W. H. Freeman

Introduction to the Practice of Statistics
Statistics
ISBN:9781319013387
Author:David S. Moore, George P. McCabe, Bruce A. Craig
Publisher:W. H. Freeman