MATLAB: An Introduction with Applications
6th Edition
ISBN: 9781119256830
Author: Amos Gilat
Publisher: John Wiley & Sons Inc
expand_more
expand_more
format_list_bulleted
Question

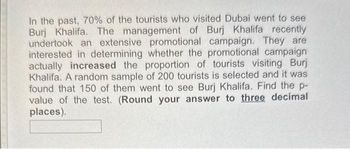
Transcribed Image Text:In the past, 70% of the tourists who visited Dubai went to see
Burj Khalifa. The management of Burj Khalifa recently
undertook an extensive promotional campaign. They are
interested in determining whether the promotional campaign
actually increased the proportion of tourists visiting Burj
Khalifa. A random sample of 200 tourists is selected and it was
found that 150 of them went to see Burj Khalifa. Find the p-
value of the test. (Round your answer to three decimal
places).
Expert Solution
This question has been solved!
Explore an expertly crafted, step-by-step solution for a thorough understanding of key concepts.
Step by stepSolved in 4 steps with 1 images

Knowledge Booster
Similar questions
- FOLLOW THE INSTRUCTIONS TYPEWRITTEN ONLY PLEASE FOR UPVOTE. DOWNVOTE FOR HANDWRITTEN. DO NOT ANSWER IF YOU ALREADY ANSWERED THISarrow_forwardGiven the 1st and 3rd quartiles of a data are 24 and 48, respectively, what value would be considered an outlier? A 83 B D 88 72 Can't tell.arrow_forwardSample proportion is 18%. Population proportion is 13%. Sample Size is 400. Calculated value of test statistic Z is a. -2.97 b. 2.97 c. 4.97 d. -4.97arrow_forward
- Aspirin prevents blood from clotting and helps prevent strokes. The Second European Stroke Prevention Study asked whether adding another anticlotting drug named dipyridamole would make a difference for patients who had already had a stroke. Here are the data on strokes during the two years of the study: Aspirin alone Apsirin & Dipyridamole Number of Patients This test is two-t led. What is the test statistic? -2.700 200 = V 200 Is there a significant difference in the proportion of strokes in the two groups? Test at a = 0.05. Round your answers to three decimal places, and round any interim calculations to four decimal places. #v Fill in the hypotheses below where p₁ denotes the proportion of patients in the aspirin group who suffered a stroke and på denotes the proportion of patients in the aspirin & dipyridamole group who suffered a stroke. Ho: P₁ Ha: P₁ Number of Strokes P₂ 60 P₂ 86 Using your answer from the previous question, find the p-value. ▼ Part 2 of 4 Part 3 of 4arrow_forwardThree hundred twenty students took a test where the scores are normally distributed. Paul's score was in the 80th percentile. How many students scored at or below Paul's score?arrow_forwardtopic is Hypothesis test for proportions. I already answered most of the question. Please help me fill the rest. Thanksarrow_forward
- The Bangor Humane Society tracks cat adoptions closely. They sample 54 people who looked at cats this month and find that 36 of them adopted cats. What is the sample proportion (p-bar)? Round your answer to 2 decimal places.arrow_forwardcant figure out where im going wrong .arrow_forwardThe average height of a person is 86 inches, with a standard variation of 5 inches. What proportion of the population is taller than 95 inches? How tall should a doorway be in order for 92 percent of individuals to pass under it? Which height corresponds to the 14th percentile?arrow_forward
- Use technology to calculate the P-value.arrow_forwardCarmen and Rosanna are two employees in an electronics store. The store manager has put an emphasis on increasing the number of applications for the store credit card. The manager randomly selected 24 weeks for each employee and recorded the number of completed applications for each week, which is provided in the samples below. Each employee completed 21 applications in one of the weeks selected. Use Excel to calculate each employee's z-score for completing 21 applications. Round your answers to two decimal places. Carmen Rosanna11 56 1115 613 185 1114 1416 521 208 1110 97 1416 1513 1310 619 2118 95 1817 310 126 1712 1214 419 1017 8arrow_forwardThe scores on a statewide math exam were normally distributed with ?=74 and ?=8. What proportion of test-takers had a grade between 66 and 88 on the exam?arrow_forward
arrow_back_ios
SEE MORE QUESTIONS
arrow_forward_ios
Recommended textbooks for you
 MATLAB: An Introduction with ApplicationsStatisticsISBN:9781119256830Author:Amos GilatPublisher:John Wiley & Sons Inc
 Probability and Statistics for Engineering and th...StatisticsISBN:9781305251809Author:Jay L. DevorePublisher:Cengage Learning
 Statistics for The Behavioral Sciences (MindTap C...StatisticsISBN:9781305504912Author:Frederick J Gravetter, Larry B. WallnauPublisher:Cengage Learning
 Elementary Statistics: Picturing the World (7th E...StatisticsISBN:9780134683416Author:Ron Larson, Betsy FarberPublisher:PEARSON
 The Basic Practice of StatisticsStatisticsISBN:9781319042578Author:David S. Moore, William I. Notz, Michael A. FlignerPublisher:W. H. Freeman
 Introduction to the Practice of StatisticsStatisticsISBN:9781319013387Author:David S. Moore, George P. McCabe, Bruce A. CraigPublisher:W. H. Freeman

MATLAB: An Introduction with Applications
Statistics
ISBN:9781119256830
Author:Amos Gilat
Publisher:John Wiley & Sons Inc

Probability and Statistics for Engineering and th...
Statistics
ISBN:9781305251809
Author:Jay L. Devore
Publisher:Cengage Learning

Statistics for The Behavioral Sciences (MindTap C...
Statistics
ISBN:9781305504912
Author:Frederick J Gravetter, Larry B. Wallnau
Publisher:Cengage Learning

Elementary Statistics: Picturing the World (7th E...
Statistics
ISBN:9780134683416
Author:Ron Larson, Betsy Farber
Publisher:PEARSON

The Basic Practice of Statistics
Statistics
ISBN:9781319042578
Author:David S. Moore, William I. Notz, Michael A. Fligner
Publisher:W. H. Freeman

Introduction to the Practice of Statistics
Statistics
ISBN:9781319013387
Author:David S. Moore, George P. McCabe, Bruce A. Craig
Publisher:W. H. Freeman