ENGR.ECONOMIC ANALYSIS
14th Edition
ISBN: 9780190931919
Author: NEWNAN
Publisher: Oxford University Press
expand_more
expand_more
format_list_bulleted
Question
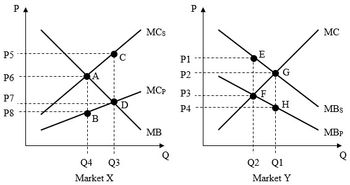
According to the above pictures, the
A. P6; Q4.
B. P7; Q3.
c. P3; Q2.
D. P2; Q1.

Transcribed Image Text:P
P5
P6
P7
P8
B
C
Q4 Q3
Market X
MCs
MCP
MB
P
P1
P2
P3
P4
E
G
H
Q2 Q1
Market Y
MC
MBS
MBP
Expert Solution
This question has been solved!
Explore an expertly crafted, step-by-step solution for a thorough understanding of key concepts.
Step by stepSolved in 2 steps

Knowledge Booster
Learn more about
Need a deep-dive on the concept behind this application? Look no further. Learn more about this topic, economics and related others by exploring similar questions and additional content below.Similar questions
- Nonearrow_forward(a) Explain the difference between a positive externality and a negative externality and why each result in an equilibrium point that is not optimal for society. (b) which externality results in an equilibrium quantity that is higher than the optimal social quantity of a good? (c) how can the impact of the externality in part b be corrected?arrow_forwardVork (Ch 10) 2. Efficiency in the presence of externalities Cars impose 'many external costs on society: exhaust emissions that contribute to air pollution, congestion on roadways, and so on. Therefore, the market equilibrium quantity of cars is not equal to the socially optimal quantity. The following graph shows the demand for cars (their private value), the supply of cars (the private cost of producing them), and the social cost of cars, including both the private cost and external costs. Use the black point (plus symbol) to indicate the market equilibrium quantity. Next, use the purple point (diamond symbol) to indicate the socially optimal quantity. Social Cost Market Equilibrium Supply (Private Cost) Socially Optimal Level Demand (Private Value) QUANTITY OF CARS PRICE OF CARSarrow_forward
- The market for plasticans is perfectly competitive. Market Supply is givenby Q=4P and Market Demand is given by Q=368-2P. Each extra unit ofplastican produced creates a positive externality of $5. What is theefficient quantity? Efficient quantity is determined by setting Marginal Social Costs(=Marg. Pvt. Cost + Marg. External Cost.) equal to Marg. SocialCost=MWTP which is captured by the Demand curvearrow_forwardShow work..arrow_forwardonly typed solutionarrow_forward
- Exhibit 30-2 Price and Cost 0 a) Refer to Exhibit 30-2. If the exhibit represents a positive externality situation, the social benefit of expanding output from Q₁ to Q₂ is the area of b) 0₁ 0₂ Q₁CBQ2. Q₁AEQ2. Q₁ABQ₂. d) ABE. Quantityarrow_forwardThe restaurant industry develops an exciting new technology, a robot that quickly prepares food in half the usual time of chefs. This increases supply (producers save costs on labor) and demand (consumers find it fun to watch the robot make a meal) such that the price remains constant. However, the robot runs on coal and produces a lot of pollution, generating an external cost on production. How do consumer and producer surplus change as a result of this new technology? Choice 1 of 4:Consumer surplus increases but the change in producer surplus is indeterminateChoice 2 of 4:Producer surplus increases but the change in consumer surplus is indeterminateChoice 3 of 4:Both producer and consumer surplus increaseChoice 4 of 4:Both producer and consumer surplus decreasearrow_forwardConsider the market illustrated in the figure to the right. Supply curve S₁ represents the private cost of production and demand curve D₁ represents the private benefit from consumption. Suppose consumption of this good creates a positive externality. Show how the externality affects the market. 1.) Use the line drawing tool to draw either a new supply (S₂) or demand (D₂) curve incorporating the positive externality in consumption. Properly label this line. 2.) Use the point drawing tool to indicate the market equilibrium price and quantity. Label this point 'Market equilibrium'. 3.) Use the point drawing tool to indicate the efficient equilibrium price and quantity. Label this point 'Efficient equilibrium'. Carefully follow the instructions above, and only draw the required objects. Price Quantity S₁ D₁ Narrow_forward
- Note:The solution should not be hand written.arrow_forwardAssume a perfectly competitive market with no externalities. The demand curve is P =52 - 0.06×Qd. The supply curve is P =0.06×Qs. In equilibrium, what is total surplus?arrow_forwardFinding an Efficient Solution, Supply: P = 10.0 + 0.1Q; Demand: P = 50.0 − 0.125Q. Let Marginal External Cost (MEC) = 0.05Q. Solve for Q and Parrow_forward
arrow_back_ios
SEE MORE QUESTIONS
arrow_forward_ios
Recommended textbooks for you

 Principles of Economics (12th Edition)EconomicsISBN:9780134078779Author:Karl E. Case, Ray C. Fair, Sharon E. OsterPublisher:PEARSON
 Engineering Economy (17th Edition)EconomicsISBN:9780134870069Author:William G. Sullivan, Elin M. Wicks, C. Patrick KoellingPublisher:PEARSON
 Principles of Economics (MindTap Course List)EconomicsISBN:9781305585126Author:N. Gregory MankiwPublisher:Cengage Learning
 Managerial Economics: A Problem Solving ApproachEconomicsISBN:9781337106665Author:Luke M. Froeb, Brian T. McCann, Michael R. Ward, Mike ShorPublisher:Cengage Learning
 Managerial Economics & Business Strategy (Mcgraw-...EconomicsISBN:9781259290619Author:Michael Baye, Jeff PrincePublisher:McGraw-Hill Education


Principles of Economics (12th Edition)
Economics
ISBN:9780134078779
Author:Karl E. Case, Ray C. Fair, Sharon E. Oster
Publisher:PEARSON

Engineering Economy (17th Edition)
Economics
ISBN:9780134870069
Author:William G. Sullivan, Elin M. Wicks, C. Patrick Koelling
Publisher:PEARSON

Principles of Economics (MindTap Course List)
Economics
ISBN:9781305585126
Author:N. Gregory Mankiw
Publisher:Cengage Learning

Managerial Economics: A Problem Solving Approach
Economics
ISBN:9781337106665
Author:Luke M. Froeb, Brian T. McCann, Michael R. Ward, Mike Shor
Publisher:Cengage Learning

Managerial Economics & Business Strategy (Mcgraw-...
Economics
ISBN:9781259290619
Author:Michael Baye, Jeff Prince
Publisher:McGraw-Hill Education