MATLAB: An Introduction with Applications
6th Edition
ISBN: 9781119256830
Author: Amos Gilat
Publisher: John Wiley & Sons Inc
expand_more
expand_more
format_list_bulleted
Concept explainers
Topic Video
Question

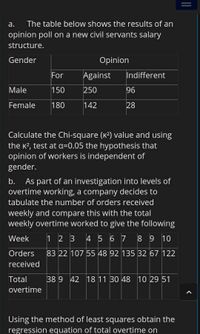
Transcribed Image Text:а.
The table below shows the results of an
opinion poll on a new civil servants salary
structure.
Gender
Opinion
For
Against
Indifferent
Male
150
250
96
Female
180
142
28
Calculate the Chi-square (K2) value and using
the K?, test at a=0.05 the hypothesis that
opinion of workers is independent of
gender.
As part of an investigation into levels of
overtime working, a company decides to
b.
tabulate the number of orders received
weekly and compare this with the total
weekly overtime worked to give the following
Week
1 2 3 4 5 6 7 8 9 10
Orders
83 22 107 55 48 92 135 32 67 122
received
Total
38 9 42 18 11 30 48 10 29 51
overtime
Using the method of least squares obtain the
regression equation of total overtime on

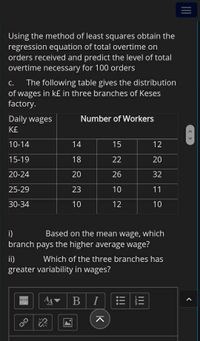
Transcribed Image Text:Using the method of least squares obtain the
regression equation of total overtime on
orders received and predict the level of total
overtime necessary for 100 orders
The following table gives the distribution
of wages in k£ in three branches of Keses
factory.
с.
Daily wages
Number of Workers
K£
10-14
14
15
12
15-19
18
22
20
20-24
20
26
32
25-29
23
10
11
30-34
10
12
10
i)
Based on the mean wage, which
branch pays the higher average wage?
ii)
Which of the three branches has
greater variability in wages?
I
< >
II
K
Expert Solution
This question has been solved!
Explore an expertly crafted, step-by-step solution for a thorough understanding of key concepts.
This is a popular solution
Trending nowThis is a popular solution!
Step by stepSolved in 4 steps with 5 images

Knowledge Booster
Learn more about
Need a deep-dive on the concept behind this application? Look no further. Learn more about this topic, statistics and related others by exploring similar questions and additional content below.Similar questions
- 3. Can SAT scores predict college performance? Let x be a variable that represents SAT score of a computer science major, and let y be a variable that represents a student’s GPA upon graduation. A random sample of n =15 computer science majors provided their SAT scores and GPAs: x 1232 1070 1086 1287 1130 1048 1121 1095 1135 1208 1333 1160 1186 1243 1261 y 3.52 2.91 2.4 3.47 3.47 2.37 2.4 2.24 3.02 3.32 3.59 2.54 3.19 3.71 3.58 The scatter diagram for the SAT score and GPA is given below: (a) Find the sample correlation coefficient r. Truncate to two decimal places. What does the value tell you about the data? (b) Find the equation of the least squares line . Truncate to four decimal places. What does the slope mean? (c) Find the value of the coefficient of determination . Truncate to two decimal places. What does this number mean? (d) What is the predicted GPA if a computer science major got a…arrow_forwardA survey of the opinions of property owners about a street widening project was taken to determine whether the resulting opinion was related to the distance of front footage. A randomly selected sample of 100 property owners was contacted and the results are shown below. Opinion Front-Footage For Undecided Against Under 45 feet 12 4 4 45 – 120 feet 35 5 30 Over 120 feet 3 2 5 What is the computed value of chi-square? 5.4787 4.9985 9.2784 7.9842 11.0355arrow_forwardIn a poll of 1500 adults in July 2010, 780 of those polled said that schools should ban sugary snacks and soft drinks. Complete parts a and b below. 1. Find the value of the test statistic z. z = _____ (Round to two decimal places as needed.) 2. Find the value of the corresponding p-value for this test statistic z. p-value = _____ (Round to three decimal places as needed.) 3. Do you reject or not reject the null hypothesis? 4. b. Choose the best interpretation of the results you obtained in part a.arrow_forward
- A sociologist wanted to determine whether there was a difference in the amount of time children 5-7 spent watching television each day. The following data was gathered. Check the data for evidence that the number of minutes spent watching television is equally distributed throughout the week. Use a=0.05. 23 Day Sun # of minutes 210 *3 # What is the value of the test statistic? E D O 71.26 с O2.82 O27.48 O72.12 C SAN DIEGO STATE stv ♫ Ⓡ $ 4 R F Mon 125 % 5 Q Search or enter address V T G A 6 Tue 140 MacBook Pro B Y H Wed 130 & 7 U N Fax: 619.594.3081 * 00 Thu 125 8 J ↑ 1 M Fri 200 ( 9 < K Sat 225 O ) 0 < L I' Parrow_forwardI need help making a relative frequency histogram from this data.arrow_forwardStatistics Questionarrow_forward
- The type of household for the U.S. population and for a random sample of 411 households from a community in Montana are shown below. Type of Household Percent of U.S.Households Observed Numberof Households inthe Community Married with children 26% 92 Married, no children 29% 121 Single parent 9% 31 One person 25% 102 Other (e.g., roommates, siblings) 11% 65 A) Find the value of the chi-square statistic for the sample. (Round the expected frequencies to two decimal places. Round the test statistic to three decimal places.) B)Find or estimate the P-value of the sample test statistic. (Round your answer to three decimal places.)arrow_forward3. Can SAT scores predict college performance? Let x be a variable that represents SAT score of a computer science major, and let y be a variable that represents a student’s GPA upon graduation. A random sample of n =15 computer science majors provided their SAT scores and GPAs: x 1232 1070 1086 1287 1130 1048 1121 1095 1135 1208 1333 1160 1186 1243 1261 y 3.52 2.91 2.4 3.47 3.47 2.37 2.4 2.24 3.02 3.32 3.59 2.54 3.19 3.71 3.58 The scatter diagram for the SAT score and GPA is given below: (a) Find the sample correlation coefficient r. Truncate to two decimal places. What does the value tell you about the data? (b) Find the equation of the least squares line . Truncate to four decimal places. What does the slope mean? (c) Find the value of the coefficient of determination . Truncate to two decimal places. What does this number mean? (d) What is the predicted GPA if a computer science major got a…arrow_forwardThe types of raw materials used to construct stone tools found at an archaeological site are shown below. A random sample of 1486 stone tools were obtained from a current excavation site. Raw Material Regional Percent of Stone Tools Observed Number of Tools as Current excavation Site Basalt 61.3% 893 Obsidian 10.6% 165 Welded Tuff 11.4% 179 Pedernal chert 13.1% 198 Other 3.6% 51 (A) Find the value of the chi-square statistic for the sample. (Round the expected frequencies to at least three decimal places. Round the test statistic to three decimal places.)arrow_forward
- We collected data for 300 people at a movie theater. For every person, we know what genre of movie they saw and whether or not they bought snacks.(we would expect 100% of people to bring snacks) Here are the results Type of Movie Snacks No Snacks Action 26 34 Comedy 47 23 Family 90 30 Horror 30 20 chi square test of independencearrow_forwardTo test whether the mean time needed to mix a batch of material is the same for machines produced by three manufacturers, the Jacobs Chemical Company obtained the following data on the time (in minutes) needed to mix the material. Compute the values below (to 2 decimals, if necessary). Sum of Squares, Treatment Sum of Squares, Error Mean Squares, Treatment Mean Squares, Error Calculate the value of the test statistic (to 2 decimals). 1 19 25 23 21 Manufacturer a. Use these data to test whether the population mean times for mixing a batch of material differ for the three manufacturers. Use a = 0.05. What conclusion can you draw after carrying out this test? - Select your answer - 2 30 28 33 29 3 21 20 24 23 The p-value is - Select your answer - V What is your conclusion? - Select your answer - b. At the a= 0.05 level of significance, use Fisher's LSD procedure to test for the equality of the means for manufacturers 1 and 3. Calculate Fisher's LSD Value (to 2 decimals).arrow_forwardTo test whether the mean time needed to mix a batch of material is the same for machines produced by three manufacturers, the Jacobs Chemical Company obtained the following data on the time (in minutes) needed to mix the material. Compute the values below (to 2 decimals, if necessary). Sum of Squares, Treatment Sum of Squares, Error a. Use these data to test whether the population mean times for mixing a batch of material differ for the three manufacturers. Use a = 0.05. Mean Squares, Treatment 0000 Mean Squares, Error Calculate the value of the test statistic (to 2 decimals). 1 17 23 21 19 What conclusion can you draw after carrying out this test? - Select your answer - Manufacturer 2 28 26 31 27 + 3 18 17 21 20 The p-value is - Select your answer - What is your conclusion? - Select your answer - b. At the a = 0.05 level of significance, use Fisher's LSD procedure to test for the equality of the means for manufacturers 1 and 3. Calculate Fisher's LSD Value (to 2 decimals).arrow_forward
arrow_back_ios
SEE MORE QUESTIONS
arrow_forward_ios
Recommended textbooks for you
 MATLAB: An Introduction with ApplicationsStatisticsISBN:9781119256830Author:Amos GilatPublisher:John Wiley & Sons Inc
 Probability and Statistics for Engineering and th...StatisticsISBN:9781305251809Author:Jay L. DevorePublisher:Cengage Learning
 Statistics for The Behavioral Sciences (MindTap C...StatisticsISBN:9781305504912Author:Frederick J Gravetter, Larry B. WallnauPublisher:Cengage Learning
 Elementary Statistics: Picturing the World (7th E...StatisticsISBN:9780134683416Author:Ron Larson, Betsy FarberPublisher:PEARSON
 The Basic Practice of StatisticsStatisticsISBN:9781319042578Author:David S. Moore, William I. Notz, Michael A. FlignerPublisher:W. H. Freeman
 Introduction to the Practice of StatisticsStatisticsISBN:9781319013387Author:David S. Moore, George P. McCabe, Bruce A. CraigPublisher:W. H. Freeman

MATLAB: An Introduction with Applications
Statistics
ISBN:9781119256830
Author:Amos Gilat
Publisher:John Wiley & Sons Inc

Probability and Statistics for Engineering and th...
Statistics
ISBN:9781305251809
Author:Jay L. Devore
Publisher:Cengage Learning

Statistics for The Behavioral Sciences (MindTap C...
Statistics
ISBN:9781305504912
Author:Frederick J Gravetter, Larry B. Wallnau
Publisher:Cengage Learning

Elementary Statistics: Picturing the World (7th E...
Statistics
ISBN:9780134683416
Author:Ron Larson, Betsy Farber
Publisher:PEARSON

The Basic Practice of Statistics
Statistics
ISBN:9781319042578
Author:David S. Moore, William I. Notz, Michael A. Fligner
Publisher:W. H. Freeman

Introduction to the Practice of Statistics
Statistics
ISBN:9781319013387
Author:David S. Moore, George P. McCabe, Bruce A. Craig
Publisher:W. H. Freeman