
MATLAB: An Introduction with Applications
6th Edition
ISBN: 9781119256830
Author: Amos Gilat
Publisher: John Wiley & Sons Inc
expand_more
expand_more
format_list_bulleted
Related questions
Question
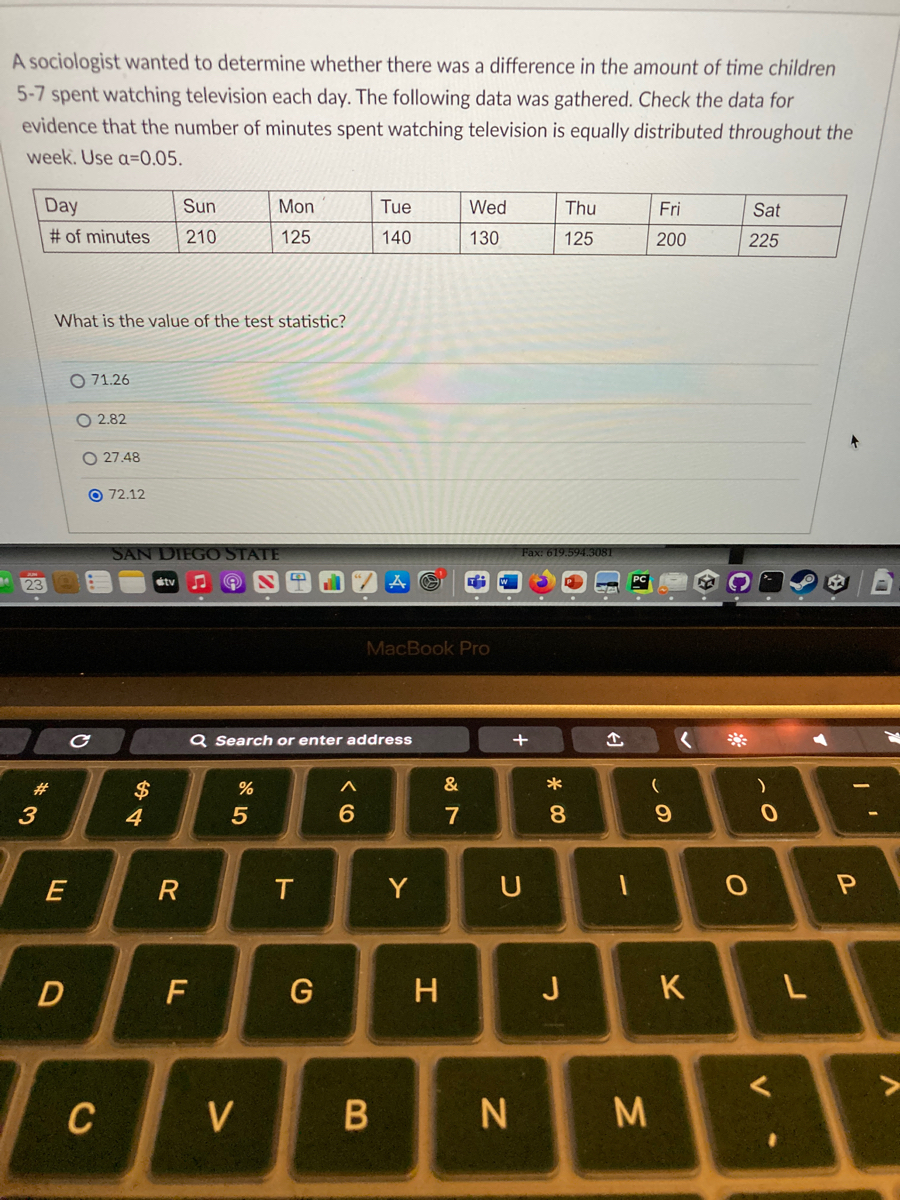

Transcribed Image Text:A sociologist wanted to determine whether there was a difference in the amount of time children
5-7 spent watching television each day. The following data was gathered. Check the data for
evidence that the number of minutes spent watching television is equally distributed throughout the
week. Use a=0.05.
23
Day
Sun
# of minutes 210
*3
#
What is the value of the test statistic?
E
D
O 71.26
с
O2.82
O27.48
O72.12
C
SAN DIEGO STATE
stv ♫ Ⓡ
$
4
R
F
Mon
125
%
5
Q Search or enter address
V
T
G
A
6
Tue
140
MacBook Pro
B
Y
H
Wed
130
&
7
U
N
Fax: 619.594.3081
* 00
Thu
125
8
J
↑
1
M
Fri
200
(
9
<
K
Sat
225
O
)
0
<
L
I'
P
Expert Solution
This question has been solved!
Explore an expertly crafted, step-by-step solution for a thorough understanding of key concepts.

This is a popular solution

Trending nowThis is a popular solution!

Step by stepSolved in 2 steps with 2 images

Knowledge Booster

Similar questions
- What is the mean of all the ninth graders scores?arrow_forwardThe next seven questions refer to the following scenario: A random sample of 16 Porsche drivers yielded an average age of 50 years with a variance of 9 years and a random sample of also 16 Ferrari drivers yielded an average of 47 years with a variance of 25 years. Porsche Driver Ferrari Driver n 16 16 mean 50 47 Variance 25 Conduct the following hypothesis test at a=0.05. HO: Mean Age Porsche Drivers Mean Age Ferrari Drivers Assume unequal variance.arrow_forward5arrow_forward
- 2arrow_forwardThe number of credits being taken by a sample of 13 full-time college students are listed below. Find the mean, median, and mode of the data, if possible. If any measure cannot be found or does not represent the center of the data, explain why. 88 11 11 8 9 77777 7 10 TMV UIG TIHVUG. VGIGLIUIG COITGGL GITVIGG VGIVW aiIU, II TIGL655aiy, mI MUIG QISWGI VUX LU Compitic yoUr GilviG. O A. The mode(s) is/are (Type an integer or decimal rounded to one decimal place as needed. Use a comma to separate answers as needed.) O B. The data set does not have a mode. Does (Do) the mode(s) represent the center of the data? O A. The mode(s) represent(s) the center. O B. The mode(s) does (do) not represent the center because it (one) is the largest data value. O C. The mode(s) does (do) not represent the center because it (one) is the smallest data value. O D. The mode(s) does (do) not represent the center because it (they) is (are) not a data value. O E. The data set does not have a mode.arrow_forwarda. Write the claim identifying H0 Ha B.find P value C. Decided whether to reject or fail d. Interpret the decision in the contextarrow_forward
- If Ashley wants to test for GPA differences among first-, second-, third-, and fourth-year college students, which of these difference tests should she use? A. chi-square test of independence B. between-subjects, two-way ANOVA C. between-subjects, one-way ANOVA D. repeated-measures ANOVAarrow_forwardHow is a sample related to a population? Choose the correct answer below. OA. A sample is a subset of a population. OB. A sample is a numerical measure that describes a sample characteristic. OC. A sample is the collection of all outcomes, responses, measurements, or counts.arrow_forward1. Explain the difference between z-tests (which use categorical data), and t-tests (which use numerical data). 2. Conduct a t-test, both when given statistics, and when given data. 3. Conduct a t-test, 2-sample t-test, and paired t-test. 4. Differentiate between the five types of tests we have learned so far.arrow_forward
- Number of persons in the household 1 2 A. Below is a distribution of the variable "hompop" from the 2016 General Social Survey dataset. This variable is a measure of the number of people in each respondent's household. Use the table to answer the following questions. 3 4 5 7 8 9 10 11 Total www Freq. 850 1,069 436 278 139 58 19 2,867 percent 29.65 37.29 15.21 9.70 4.85 2.02 0.66 0.31 0.24 0.03 0.03 100.00 Cum. 29.65 66.93 82.14 91.84 96.69 98.71 99.37 99.69 99.93 99.97 100.00 1arrow_forwardShown below are the lengths in minutes of 6 randomly selected Disney movies. Use the data to compute each of the items requested. Don't forget to put units on your answers. Bambi 69 Cinderella 74 The Rescuers 78 Dumbo 64 Monsters, Inc 92 Wall E 98 What is the sample mean?arrow_forwardThere are 15 numbers on a list, and the smallest number is changed from 4 to 0.4.a) Is it possible to determine by how much the mean changes? If so, by how much does it change?b) Is it possible to determine the value of the mean after the change? If so, what is the value?c) Is it possible to determine by how much the median changes? If so, by how much does it change?d) Is it possible to determine by how much the standard deviation changes? If so, by how much does it changearrow_forward
arrow_back_ios
SEE MORE QUESTIONS
arrow_forward_ios
Recommended textbooks for you
- MATLAB: An Introduction with ApplicationsStatisticsISBN:9781119256830Author:Amos GilatPublisher:John Wiley & Sons Inc
 Probability and Statistics for Engineering and th...StatisticsISBN:9781305251809Author:Jay L. DevorePublisher:Cengage Learning
 Statistics for The Behavioral Sciences (MindTap C...StatisticsISBN:9781305504912Author:Frederick J Gravetter, Larry B. WallnauPublisher:Cengage Learning
  Elementary Statistics: Picturing the World (7th E...StatisticsISBN:9780134683416Author:Ron Larson, Betsy FarberPublisher:PEARSON
 The Basic Practice of StatisticsStatisticsISBN:9781319042578Author:David S. Moore, William I. Notz, Michael A. FlignerPublisher:W. H. Freeman
 Introduction to the Practice of StatisticsStatisticsISBN:9781319013387Author:David S. Moore, George P. McCabe, Bruce A. CraigPublisher:W. H. Freeman
MATLAB: An Introduction with Applications
Statistics
ISBN:9781119256830
Author:Amos Gilat
Publisher:John Wiley & Sons Inc
Probability and Statistics for Engineering and th...
Statistics
ISBN:9781305251809
Author:Jay L. Devore
Publisher:Cengage Learning
Statistics for The Behavioral Sciences (MindTap C...
Statistics
ISBN:9781305504912
Author:Frederick J Gravetter, Larry B. Wallnau
Publisher:Cengage Learning
Elementary Statistics: Picturing the World (7th E...
Statistics
ISBN:9780134683416
Author:Ron Larson, Betsy Farber
Publisher:PEARSON
The Basic Practice of Statistics
Statistics
ISBN:9781319042578
Author:David S. Moore, William I. Notz, Michael A. Fligner
Publisher:W. H. Freeman
Introduction to the Practice of Statistics
Statistics
ISBN:9781319013387
Author:David S. Moore, George P. McCabe, Bruce A. Craig
Publisher:W. H. Freeman